10-Q: Quarterly report [Sections 13 or 15(d)]
Published on July 23, 2026
UNITED STATES
SECURITIES AND EXCHANGE COMMISSION
Washington, D.C. 20549
___________________________________________________
FORM 10-Q
For the quarterly period ended June 30, 2026
OR
For the transition period from to
Commission File Number 1-4422
 | ||
(Exact name of registrant as specified in its charter) | ||
| (State or other jurisdiction of incorporation or organization) | (I.R.S. Employer Identification No.) | |||||||
(Address of principal executive offices)
(Zip Code)
(404 ) 888-2000
(Registrant’s telephone number, including area code)
___________________________________________________
Securities registered pursuant to Section 12(b) of the Act:
| Title of each class | Trading Symbol(s) | Name of each exchange on which registered | ||||||
Indicate by check mark whether the registrant (1) has filed all reports required to be filed by Section 13 or 15(d) of the Securities Exchange Act of 1934 during the preceding 12 months (or for such shorter period that the registrant was required to file such reports), and (2) has been subject to such filing requirements for the past 90 days. Yes x No o
Indicate by check mark whether the registrant has submitted electronically, every Interactive Data File required to be submitted pursuant to Rule 405 of Regulation S-T (§232.405 of this chapter) during the preceding 12 months (or for such shorter period that the registrant was required to submit such files). Yes x No o
Indicate by check mark whether the registrant is a large accelerated filer, an accelerated filer, a non-accelerated filer, smaller reporting company, or an emerging growth company. See the definitions of “large accelerated filer,” “accelerated filer,” “smaller reporting company,” and “emerging growth company” in Rule 12b-2 of the Exchange Act.
| x | Accelerated filer | o | ||||||||||||
| Non-accelerated filer | o | Smaller reporting company | ||||||||||||
| Emerging growth company | ||||||||||||||
If an emerging growth company, indicate by check mark if the registrant has elected not to use the extended transition period for complying with any new or revised financial accounting standards provided pursuant to Section 13(a) of the Exchange Act. o
Indicate by check mark whether the registrant is a shell company (as defined in Rule 12b-2 of the Exchange Act).
Yes ☐ No x
Rollins, Inc. had 481,145,404 shares of its $1 par value Common Stock outstanding as of July 13, 2026.
ROLLINS, INC. AND SUBSIDIARIES
TABLE OF CONTENTS
| Pages | ||||||||
2
ROLLINS, INC. AND SUBSIDIARIES
PART I FINANCIAL INFORMATION
ITEM 1. FINANCIAL STATEMENTS
CONDENSED CONSOLIDATED STATEMENTS OF FINANCIAL POSITION
AS OF JUNE 30, 2026 AND DECEMBER 31, 2025
(in thousands except share data)
(unaudited)
| June 30, 2026 | December 31, 2025 | ||||||||||
| ASSETS | |||||||||||
| Cash and cash equivalents | $ | $ | |||||||||
Trade receivables, net of allowance for expected credit losses of $ | |||||||||||
Financed receivables, short-term, net of allowance for expected credit losses of $ | |||||||||||
| Materials and supplies | |||||||||||
| Other current assets | |||||||||||
| Total current assets | |||||||||||
Equipment and property, net of accumulated depreciation of $ | |||||||||||
| Goodwill | |||||||||||
| Customer contracts, net | |||||||||||
| Trademarks & tradenames, net | |||||||||||
| Other intangible assets, net | |||||||||||
| Operating lease right-of-use assets | |||||||||||
Financed receivables, long-term, net of allowance for expected credit losses of $ | |||||||||||
| Other assets | |||||||||||
| Total assets | $ | $ | |||||||||
| LIABILITIES | |||||||||||
| Short-term debt | $ | $ | |||||||||
| Accounts payable | |||||||||||
| Accrued insurance - current | |||||||||||
| Accrued compensation and related liabilities | |||||||||||
| Unearned revenues | |||||||||||
| Operating lease liabilities - current | |||||||||||
| Other current liabilities | |||||||||||
| Total current liabilities | |||||||||||
| Accrued insurance, less current portion | |||||||||||
| Operating lease liabilities, less current portion | |||||||||||
| Long-term debt | |||||||||||
| Other long-term accrued liabilities | |||||||||||
| Total liabilities | |||||||||||
| Commitments and contingencies (see Note 9) | |||||||||||
| STOCKHOLDERS’ EQUITY | |||||||||||
Preferred stock, without par value; | |||||||||||
Common stock, par value $ | |||||||||||
| Additional paid in capital | |||||||||||
| Accumulated other comprehensive (loss) income | ( | ( | |||||||||
| Retained earnings | |||||||||||
| Total stockholders’ equity | |||||||||||
| Total liabilities and stockholders’ equity | $ | $ | |||||||||
The accompanying notes are an integral part of these condensed consolidated financial statements.
3
ROLLINS, INC. AND SUBSIDIARIES
CONDENSED CONSOLIDATED STATEMENTS OF INCOME
FOR THE THREE AND SIX MONTHS ENDED JUNE 30, 2026 AND 2025
(in thousands except per share data)
(unaudited)
| Three Months Ended June 30, | Six Months Ended June 30, | ||||||||||||||||||||||
| 2026 | 2025 | 2026 | 2025 | ||||||||||||||||||||
| REVENUES | |||||||||||||||||||||||
| $ | $ | $ | $ | ||||||||||||||||||||
| COSTS AND EXPENSES | |||||||||||||||||||||||
| Cost of services provided (exclusive of depreciation and amortization below) | |||||||||||||||||||||||
| Sales, general and administrative | |||||||||||||||||||||||
| Depreciation and amortization | |||||||||||||||||||||||
| Total operating expenses | |||||||||||||||||||||||
| OPERATING INCOME | |||||||||||||||||||||||
| Interest expense, net | |||||||||||||||||||||||
| Other expense (income), net | ( | ( | |||||||||||||||||||||
| CONSOLIDATED INCOME BEFORE INCOME TAXES | |||||||||||||||||||||||
| PROVISION FOR INCOME TAXES | |||||||||||||||||||||||
| NET INCOME | $ | $ | $ | $ | |||||||||||||||||||
| NET INCOME PER SHARE - BASIC AND DILUTED | $ | $ | $ | $ | |||||||||||||||||||
| Weighted average shares outstanding – basic | |||||||||||||||||||||||
| Weighted average shares outstanding – diluted | |||||||||||||||||||||||
| DIVIDENDS PAID PER SHARE | $ | $ | $ | $ | |||||||||||||||||||
The accompanying notes are an integral part of these condensed consolidated financial statements.
4
ROLLINS, INC. AND SUBSIDIARIES
CONDENSED CONSOLIDATED STATEMENTS OF COMPREHENSIVE INCOME
FOR THE THREE AND SIX MONTHS ENDED JUNE 30, 2026 AND 2025
(in thousands)
(unaudited)
| Three Months Ended June 30, | Six Months Ended June 30, | ||||||||||||||||||||||
| 2026 | 2025 | 2026 | 2025 | ||||||||||||||||||||
| NET INCOME | $ | $ | $ | $ | |||||||||||||||||||
| Other comprehensive (loss) income, net of tax: | |||||||||||||||||||||||
| Foreign currency translation adjustments | ( | ( | |||||||||||||||||||||
| Pension settlement | |||||||||||||||||||||||
| Unrealized gain (loss) on available for sale securities | |||||||||||||||||||||||
| Other comprehensive (loss) income, net of tax | ( | ( | |||||||||||||||||||||
| Comprehensive income | $ | $ | $ | $ | |||||||||||||||||||
The accompanying notes are an integral part of these condensed consolidated financial statements.
5
ROLLINS, INC. AND SUBSIDIARIES
CONDENSED CONSOLIDATED STATEMENTS OF STOCKHOLDERS’ EQUITY
FOR THE THREE MONTHS ENDED JUNE 30, 2026 AND 2025
(in thousands)
(unaudited)
| Common Stock | Additional Paid-in Capital | Accumulated Other Comprehensive (Loss) Income | Retained Earnings | Total | |||||||||||||||||||||||||||||||
| Shares | Amount | ||||||||||||||||||||||||||||||||||
| Balance at March 31, 2026 | $ | $ | $ | ( | $ | $ | |||||||||||||||||||||||||||||
| Net income | — | — | — | — | |||||||||||||||||||||||||||||||
| Other comprehensive (loss) income, net of tax: | |||||||||||||||||||||||||||||||||||
| Foreign currency translation adjustments | — | — | — | ( | — | ( | |||||||||||||||||||||||||||||
| Unrealized gain on available for sale securities | — | — | — | — | |||||||||||||||||||||||||||||||
| Cash dividends | — | — | — | — | ( | ( | |||||||||||||||||||||||||||||
| Stock compensation | — | — | |||||||||||||||||||||||||||||||||
| Shares withheld for payment of employee taxes | ( | ( | ( | — | — | ( | |||||||||||||||||||||||||||||
| Repurchase and retirement of common stock, including excise tax | ( | ( | — | ( | ( | ||||||||||||||||||||||||||||||
| Balance at June 30, 2026 | $ | $ | $ | ( | $ | $ | |||||||||||||||||||||||||||||
| Common Stock | Additional Paid-in Capital | Accumulated Other Comprehensive (Loss) Income | Retained Earnings | Total | |||||||||||||||||||||||||||||||
| Shares | Amount | ||||||||||||||||||||||||||||||||||
| Balance at March 31, 2025 | $ | $ | $ | ( | $ | $ | |||||||||||||||||||||||||||||
| Net income | — | — | — | — | |||||||||||||||||||||||||||||||
| Other comprehensive (loss) income, net of tax: | |||||||||||||||||||||||||||||||||||
| Foreign currency translation adjustments | — | — | — | — | |||||||||||||||||||||||||||||||
| Unrealized gain on available for sale securities | — | — | — | — | |||||||||||||||||||||||||||||||
| Cash dividends | — | — | — | — | ( | ( | |||||||||||||||||||||||||||||
| Stock compensation | — | — | |||||||||||||||||||||||||||||||||
| Shares withheld for payment of employee taxes | ( | ( | ( | — | — | ( | |||||||||||||||||||||||||||||
| Balance at June 30, 2025 | $ | $ | $ | ( | $ | $ | |||||||||||||||||||||||||||||
The accompanying notes are an integral part of these condensed consolidated financial statements.
6
ROLLINS, INC. AND SUBSIDIARIES
CONDENSED CONSOLIDATED STATEMENTS OF STOCKHOLDERS’ EQUITY
FOR THE SIX MONTHS ENDED JUNE 30, 2026 AND 2025
(in thousands)
(unaudited)
| Common Stock | Additional Paid-in Capital | Accumulated Other Comprehensive (Loss) Income | Retained Earnings | Total | |||||||||||||||||||||||||||||||
| Shares | Amount | ||||||||||||||||||||||||||||||||||
| Balance at December 31, 2025 | $ | $ | $ | ( | $ | $ | |||||||||||||||||||||||||||||
| Net income | — | — | — | — | |||||||||||||||||||||||||||||||
| Other comprehensive (loss) income, net of tax: | |||||||||||||||||||||||||||||||||||
| Foreign currency translation adjustments | — | — | — | ( | — | ( | |||||||||||||||||||||||||||||
| Unrealized gain on available for sale securities | — | — | — | — | |||||||||||||||||||||||||||||||
| Cash dividends | — | — | — | — | ( | ( | |||||||||||||||||||||||||||||
| Stock compensation | — | — | |||||||||||||||||||||||||||||||||
| Shares withheld for payment of employee taxes | ( | ( | ( | — | — | ( | |||||||||||||||||||||||||||||
| Repurchase and retirement of common stock, including excise tax | ( | ( | — | — | ( | ( | |||||||||||||||||||||||||||||
| Balance at June 30, 2026 | $ | $ | $ | ( | $ | $ | |||||||||||||||||||||||||||||
| Common Stock | Additional Paid-in Capital | Accumulated Other Comprehensive (Loss) Income | Retained Earnings | Total | |||||||||||||||||||||||||||||||
| Shares | Amount | ||||||||||||||||||||||||||||||||||
| Balance at December 31, 2024 | $ | $ | $ | ( | $ | $ | |||||||||||||||||||||||||||||
| Net income | — | — | — | — | |||||||||||||||||||||||||||||||
| Other comprehensive (loss) income, net of tax: | |||||||||||||||||||||||||||||||||||
| Foreign currency translation adjustments | — | — | — | — | |||||||||||||||||||||||||||||||
| Pension settlement | — | — | — | — | |||||||||||||||||||||||||||||||
| Unrealized gain on available for sale securities | — | — | — | — | |||||||||||||||||||||||||||||||
| Cash dividends | — | — | — | — | ( | ( | |||||||||||||||||||||||||||||
| Stock compensation | — | — | |||||||||||||||||||||||||||||||||
| Shares withheld for payment of employee taxes | ( | ( | ( | — | — | ( | |||||||||||||||||||||||||||||
| Balance at June 30, 2025 | $ | $ | $ | ( | $ | $ | |||||||||||||||||||||||||||||
The accompanying notes are an integral part of these condensed consolidated financial statements.
7
ROLLINS, INC. AND SUBSIDIARIES
CONDENSED CONSOLIDATED STATEMENTS OF CASH FLOWS
FOR THE SIX MONTHS ENDED JUNE 30, 2026 AND 2025
(in thousands)
(unaudited)
| Six Months Ended June 30, | |||||||||||
| 2026 | 2025 | ||||||||||
| OPERATING ACTIVITIES | |||||||||||
| Net income | $ | $ | |||||||||
| Adjustments to reconcile net income to net cash provided by operating activities: | |||||||||||
| Depreciation and amortization | |||||||||||
| Stock-based compensation expense | |||||||||||
| Provision for expected credit losses | |||||||||||
| Loss (gain) on sale of assets, net | ( | ||||||||||
| Provision for deferred income taxes | |||||||||||
| Other operating activities, net | ( | ||||||||||
| Changes in operating assets and liabilities: | |||||||||||
| Trade accounts receivable | ( | ( | |||||||||
| Financing receivables | ( | ( | |||||||||
| Materials and supplies | ( | ( | |||||||||
| Other current assets | ( | ( | |||||||||
| Accounts payable and accrued expenses | |||||||||||
| Unearned revenue | |||||||||||
| Other long-term assets and liabilities | ( | ||||||||||
| Net cash provided by operating activities | |||||||||||
| INVESTING ACTIVITIES | |||||||||||
| Acquisitions, net of cash acquired | ( | ( | |||||||||
| Capital expenditures | ( | ( | |||||||||
| Proceeds from sale of assets | |||||||||||
| Other investing activities, net | |||||||||||
| Net cash used in investing activities | ( | ( | |||||||||
| FINANCING ACTIVITIES | |||||||||||
| Payment of contingent consideration | ( | ( | |||||||||
| Issuance of senior notes | |||||||||||
| Borrowings under revolving commitment | |||||||||||
| Borrowings under commercial paper, net | |||||||||||
| Repayments of revolving commitment | ( | ||||||||||
| Payment of debt issuance costs | ( | ||||||||||
| Payment of dividends | ( | ( | |||||||||
| Cash paid for common stock purchased | ( | ( | |||||||||
| Other financing activities, net | ( | ( | |||||||||
| Net cash used in financing activities | ( | ( | |||||||||
| Effect of exchange rate changes on cash | ( | ||||||||||
| Net increase in cash and cash equivalents | |||||||||||
| Cash and cash equivalents at beginning of period | |||||||||||
| Cash and cash equivalents at end of period | $ | $ | |||||||||
| Supplemental disclosure of cash flow information: | |||||||||||
| Cash paid for interest | $ | $ | |||||||||
| Cash paid for income taxes, net | $ | $ | |||||||||
| Non-cash additions to operating lease right-of-use assets | $ | $ | |||||||||
The accompanying notes are an integral part of these condensed consolidated financial statements.
8
ROLLINS, INC. AND SUBSIDIARIES
NOTE 1. BASIS OF PREPARATION
Basis of Preparation
The accompanying unaudited condensed consolidated financial statements have been prepared in accordance with accounting principles generally accepted in the United States of America, or U.S. GAAP, the instructions to Form 10-Q and applicable sections of Securities and Exchange Commission ("SEC") regulation S-X, and therefore do not include all information and footnotes required by U.S. GAAP for complete financial statements. There have been no material changes in the Company’s significant accounting policies or the information disclosed in the notes to the consolidated financial statements included in the Annual Report on Form 10-K of Rollins, Inc. (including its subsidiaries unless the context otherwise requires, “Rollins,” “we,” “us,” “our,” or the “Company”) for the year ended December 31, 2025. Accordingly, the quarterly condensed consolidated financial statements and related disclosures herein should be read in conjunction with the 2025 Annual Report on Form 10-K.
The Company’s condensed consolidated financial statements reflect estimates and assumptions made by management that affect the reported amounts of assets and liabilities and related disclosures as of the date of the condensed consolidated financial statements. The Company considered the impact of economic trends on the assumptions and estimates used in preparing the condensed consolidated financial statements. In the opinion of management, all material adjustments necessary for a fair presentation of the Company’s financial results for the quarter have been made. These adjustments are of a normal recurring nature but complicated by the continued uncertainty surrounding economic trends. The results of operations for the three and six months ended June 30, 2026 are not necessarily indicative of results for the entire year. The severity, magnitude and duration of certain economic trends continue to be uncertain and are difficult to predict. Therefore, our accounting estimates and assumptions may change over time in response to economic trends and may change materially in future periods.
NOTE 2. RECENT ACCOUNTING PRONOUNCEMENTS
Recently adopted accounting standards
In July 2025, the Financial Accounting Standards Board (“FASB”) issued Accounting Standards Update ("ASU") 2025-05, Financial Instruments—Credit Losses (Topic 326): Measurement of Credit Losses for Accounts Receivable and Contract Assets. The guidance provides an optional practical expedient when applying the guidance related to the estimation of expected credit losses for current accounts receivable and current contract assets resulting from transactions arising from contracts with customers. The Company adopted the ASU effective January 1, 2026 on a prospective basis and elected the practical expedient for the calculation of current expected credit losses. The adoption did not have a material impact on the Company’s condensed consolidated financial statements.
Accounting standards issued but not yet adopted
In October 2023, the FASB issued ASU 2023-06, “Disclosure Improvements: Codification Amendments in Response to the SEC’s Disclosure Update and Simplification Initiative,” to amend certain disclosure and presentation requirements for a variety of topics within the Accounting Standards Codification ("ASC"). These amendments align the requirements in the ASC to the removal of certain disclosure requirements set out in Regulation S-X and Regulation S-K, announced by the SEC. The effective date for each amended topic in the ASC is either the date on which the SEC’s removal of the related disclosure requirement from Regulation S-X or Regulation S-K becomes effective, or on June 30, 2027, if the SEC has not removed the requirements by that date. Early adoption is prohibited. The Company does not expect that the application of this standard will have a material impact on its condensed consolidated financial statements or disclosures.
In November 2024, the FASB issued ASU 2024-03, Disaggregation of Income Statement Expenses (DISE), which requires additional disclosure of the nature of expenses included in the income statement in response to longstanding requests from investors for more information about an entity’s expenses. The new standard requires disclosures about specific types of expenses included in the expense captions presented on the face of the income statement as well as disclosures about selling expenses. The guidance will be effective for annual reporting periods beginning after December 15, 2026 and interim reporting periods beginning after December 15, 2027. The requirements will be applied prospectively with the option for retrospective application. Early adoption is permitted. The Company is currently evaluating the impact that the adoption of this ASU will have on its disclosures.
9
ROLLINS, INC. AND SUBSIDIARIES
In September 2025, the FASB issued ASU 2025-06, Intangibles—Goodwill and Other—Internal-Use Software (Subtopic 350-40): Targeted Improvements to the Accounting for Internal-Use Software. The guidance modernizes and clarifies the threshold for when an entity is required to start capitalizing software costs and is based on when (i) management has authorized and committed to funding the software project and (ii) it is probable that the project will be completed and the software will be used to perform the function intended. The amendments in ASU 2025-06 are effective for fiscal years beginning after December 15, 2027, and interim reporting periods within those annual reporting periods. The requirements will be applied prospectively with the option for a modified or retrospective application. Early adoption is permitted as of the beginning of an annual reporting period. The Company does not expect that the application of this standard will have a material impact on its condensed consolidated financial statements or disclosures.
In December 2025, the FASB issued ASU 2025-11, Interim Reporting (Topic 270): Narrow-Scope Improvements. The update improves the guidance in Topic 270, Interim Reporting, by improving the navigability of the required interim disclosures and clarifying when that guidance is applicable. The amendments in ASU 2025-11 are effective for interim reporting periods within annual reporting periods beginning after December 15, 2027, with early adoption permitted. The amendments can be applied either prospectively or retrospectively to any or all prior periods presented in the financial statements. The Company is currently evaluating the impact that the adoption of this ASU will have on its condensed consolidated financial statements and related disclosures.
In December 2025, the FASB issued ASU 2025-12, Codification Improvements (Evergreen). This evergreen project facilitates Codification updates for a broad range of Topics arising from technical corrections, the unintended application of the Codification, clarifications, and other minor improvements. The Company is currently evaluating the impact that the adoption of this ASU will have on its condensed consolidated financial statements and related disclosures.
NOTE 3. ACQUISITIONS
Romex Pest Control Acquisition
On April 1, 2026, the Company acquired 100 % of Romex Pest Control, LLC ("Romex") for $95.7 million. The Company funded this acquisition using cash on hand and borrowings under the commercial paper program.
The acquisition expanded the Rollins family of brands, and management believes the acquisition will drive long-term value given Romex's attractive financial profile and complementary end market exposure.
The Romex acquisition has been accounted for as a business combination, and Romex's results of operations are included in the Company's operations from the acquisition date. During the three months ended June 30, 2026, Romex contributed revenues and net earnings of $10.2 million and $0.8 million, respectively.
The valuation of the Romex acquisition was performed by a third party valuation specialist under management’s supervision. The preliminary values of identified assets acquired and liabilities assumed as of June 30, 2026 are summarized as follows:
10
ROLLINS, INC. AND SUBSIDIARIES
(in thousands) | April 1, 2026 | ||||
| Cash | $ | ||||
| Accounts receivable | |||||
| Materials and supplies | |||||
| Other current assets | |||||
| Equipment and property | |||||
| Goodwill | |||||
| Customer contracts | |||||
| Trademarks & tradenames | |||||
| Operating lease right-of-use assets | |||||
| Accounts payable | ( | ||||
| Accrued compensation and related liabilities | ( | ||||
| Other current liabilities | ( | ||||
| Operating lease liabilities | ( | ||||
| Unearned revenue | ( | ||||
| Assets acquired and liabilities assumed | $ | ||||
Included in the total consideration above are cash payments of $85.5 million made upon closing, contingent consideration valued at $5.2 million that is based on Romex's expected financial performance in the two years following the acquisition, and holdback liabilities valued at $5.0 million to be held by the Company to settle indemnity claims and purchase price adjustments. The fair value of the contingent consideration was estimated using a Monte Carlo simulation. During the three months ended June 30, 2026, we recognized a charge of $0.9 million related to adjustments to the fair value of contingent consideration resulting from the acquisition of Romex. This charge is reported in sales, general and administrative expenses on our condensed consolidated statement of income.
The acquired Romex customer contracts are estimated to have a remaining useful life of 9.5 years. The acquired trademarks and tradenames are expected to have an indefinite useful life. See Note 6, Goodwill and Intangible Assets, for further details.
Goodwill from this acquisition represents the excess of the purchase price over the fair value of net assets of the business acquired. The factors contributing to the amount of goodwill are based on strategic and synergistic benefits that are expected to be realized. The recognized goodwill is expected to be deductible for tax purposes.
Pro Forma Financial Information
The following table presents unaudited consolidated pro forma information as if the acquisition of Romex had occurred on January 1, 2025. This information presented below is for illustrative purposes only and is not necessarily indicative of results that would have been achieved if the acquisition had actually occurred as of the beginning of such years or results which may be achieved in the future.
| Three Months Ended June 30, | Six Months Ended June 30, | ||||||||||||||||||||||
| (in thousands) | 2026 | 2025 | 2026 | 2025 | |||||||||||||||||||
| Revenues | $ | $ | $ | $ | |||||||||||||||||||
| Net income | |||||||||||||||||||||||
11
ROLLINS, INC. AND SUBSIDIARIES
The information adjusts for the effects of material business combination items, including the alignment of accounting policies, the effect of fair value adjustments including the amortization of acquired intangible assets, and income tax effects.
Other 2026 Acquisitions
The Company made eight other acquisitions during the six months ended June 30, 2026. The aggregate preliminary values of major classes of assets acquired and liabilities assumed recorded at the dates of acquisition are summarized as follows:
(in thousands) | 2026 | ||||
| Cash | $ | ||||
| Accounts receivable | |||||
| Materials and supplies | |||||
| Equipment and property | |||||
| Goodwill | |||||
| Customer contracts | |||||
| Trademarks & tradenames | |||||
| Accrued compensation and related liabilities | ( | ||||
| Unearned revenue | ( | ||||
| Other assets and liabilities, net | |||||
| Assets acquired and liabilities assumed | $ | ||||
Included in the total consideration of $56.3 million are acquisition holdback liabilities of $5.1 million.
Goodwill from acquisitions represents the excess of the purchase price over the fair value of net assets of businesses acquired. The factors contributing to the amount of goodwill are based on strategic and synergistic benefits that are expected to be realized. A majority of the recognized goodwill is expected to be deductible for tax purposes. Valuations of certain assets and liabilities, including intangible assets and goodwill, as of the acquisition date have not been finalized at this time and are provisional.
Saela Pest Control Acquisition
On April 1, 2025, the Company acquired 100 % of Saela Holdings, LLC ("Saela") for $207.2 million. The Company funded this acquisition using cash on hand and borrowings under the commercial paper program.
The acquisition expanded the Rollins family of brands, and management believes the acquisition will drive long-term value given Saela's attractive financial profile and complementary end market exposure.
The Saela acquisition was accounted for as a business combination, and Saela's results of operations are included in the Company's operations from the acquisition date.
The valuation of the Saela acquisition was performed by a third party valuation specialist under management’s supervision. The values of identified assets acquired and liabilities assumed were finalized as of March 31, 2026 and are summarized as follows:
12
ROLLINS, INC. AND SUBSIDIARIES
(in thousands) | Final Fair Value | ||||
| Cash | $ | ||||
| Accounts receivable | |||||
| Materials and supplies | |||||
| Other current assets | |||||
| Equipment and property | |||||
| Goodwill | |||||
| Customer contracts | |||||
| Trademarks & tradenames | |||||
| Operating lease right-of-use assets | |||||
| Accounts payable | ( | ||||
| Accrued compensation and related liabilities | ( | ||||
| Other current liabilities | ( | ||||
| Operating lease liabilities | ( | ||||
| Assets acquired and liabilities assumed | $ | ||||
Included in the total consideration above were cash payments of $193.7 million made upon closing, contingent consideration valued at $8.8 million that is based on Saela's expected financial performance in the two years following the acquisition, and holdback liabilities valued at $4.7 million to be held by the Company to settle indemnity claims and purchase price adjustments. The fair value of the contingent consideration was estimated using a Monte Carlo simulation. During the three and six months ended June 30, 2026, we recognized a charge of $0.5 million and $1.5 million, respectively, related to adjustments to the fair value of contingent consideration resulting from the acquisition of Saela. This charge is reported in sales, general and administrative expenses on our condensed consolidated statement of income.
The acquired Saela customer contracts were estimated to have a remaining useful life of 7 years. The acquired trademarks and tradenames are expected to have an indefinite useful life. See Note 6, Goodwill and Intangible Assets, for further details.
Goodwill from this acquisition represents the excess of the purchase price over the fair value of net assets of the business acquired. The factors contributing to the amount of goodwill are based on strategic and synergistic benefits that are expected to be realized. The recognized goodwill is expected to be deductible for tax purposes.
Pro Forma Financial Information
The following table presents unaudited consolidated pro forma information as if the acquisition of Saela had occurred on January 1, 2024. This information presented below is for illustrative purposes only and is not necessarily indicative of results that would have been achieved if the acquisition had actually occurred as of the beginning of such years or results which may be achieved in the future.
| Three Months Ended June 30, | Six Months Ended June 30, | ||||||||||
| (in thousands) | 2025 | 2025 | |||||||||
| Revenues | $ | $ | |||||||||
| Net income | |||||||||||
The information adjusts for the effects of material business combination items, including the alignment of accounting policies, the effect of fair value adjustments including the amortization of acquired intangible assets, and income tax effects.
13
ROLLINS, INC. AND SUBSIDIARIES
NOTE 4. REVENUE
Revenue, classified by the major geographic areas in which our customers are located, was as follows:
| Three Months Ended June 30, | Six Months Ended June 30, | ||||||||||||||||||||||
| (in thousands) | 2026 | 2025 | 2026 | 2025 | |||||||||||||||||||
| United States | $ | $ | $ | $ | |||||||||||||||||||
| Other countries | |||||||||||||||||||||||
| Total revenues | $ | $ | $ | $ | |||||||||||||||||||
Revenue from external customers, classified by significant service offering, was as follows:
| Three Months Ended June 30, | Six Months Ended June 30, | ||||||||||||||||||||||
| (in thousands) | 2026 | 2025 | 2026 | 2025 | |||||||||||||||||||
| Residential revenues | $ | $ | $ | $ | |||||||||||||||||||
| Commercial revenues | |||||||||||||||||||||||
| Termite and ancillary revenues | |||||||||||||||||||||||
| Franchise revenues | |||||||||||||||||||||||
| Other revenues | |||||||||||||||||||||||
| Total revenues | $ | $ | $ | $ | |||||||||||||||||||
The Company records unearned revenue when we have either received payment or contractually have the right to bill for services in advance of the services or performance obligations being performed. Unearned revenue recognized as revenues in the three months ended June 30, 2026 and 2025 was $75.7 million and $68.9 million, respectively. Unearned revenue recognized in the six months ended June 30, 2026 and 2025 was $148.9 million and $135.9 million, respectively. Changes in unearned revenue were as follows:
| Three Months Ended June 30, | Six Months Ended June 30, | ||||||||||||||||||||||
| (in thousands) | 2026 | 2025 | 2026 | 2025 | |||||||||||||||||||
| Beginning balance | $ | $ | $ | $ | |||||||||||||||||||
| Deferral of unearned revenue | |||||||||||||||||||||||
| Recognition of unearned revenue | ( | ( | ( | ( | |||||||||||||||||||
| Ending balance | $ | $ | $ | $ | |||||||||||||||||||
As of June 30, 2026 and December 31, 2025, the Company had long-term unearned revenue of $52.8 million and $45.3 million, respectively, recorded in other long-term accrued liabilities on our condensed consolidated statements of financial position. Unearned short-term revenue is recognized over the next 12-month period. During the three and six months ended June 30, 2026, we recognized approximately $46.9 million and $93.8 million of revenue that was included in the balance of unearned revenue at December 31, 2025. During the three and six months ended June 30, 2025, we recognized approximately $45.2 million and $90.4 million of revenue that was included in the balance of unearned revenue at December 31, 2024. The majority of unearned long-term revenue is recognized over a period of five years or less with immaterial amounts recognized through 2036.
Incremental Costs of Obtaining a Contract with a Customer
Incremental costs of obtaining a contract include only those costs that we incur to obtain a contract that we would not have incurred if the contract had not been obtained, primarily sales commissions. These costs are recorded as an asset and amortized to expense over the life of the contract to the extent such costs are expected to be recovered. As of June 30, 2026, we have $53.9 million of unamortized capitalized costs to obtain a contract, of which $39.2 million is recorded within other current assets and $14.7 million is recorded within other assets on our condensed consolidated statements of financial position. As of December 31, 2025, we had $39.1 million of unamortized capitalized costs to obtain a contract, of
14
ROLLINS, INC. AND SUBSIDIARIES
which $28.9 million was recorded within other current assets and $10.2 million was recorded within other assets on our condensed consolidated statements of financial position. Amortization of capitalized costs is recorded within sales, general and administrative expense on our condensed consolidated statements of income. During the three and six months ended June 30, 2026, we recorded approximately $10.5 million and $20.0 million in amortization of capitalized costs, respectively. During the three and six months ended June 30, 2025, we recorded approximately $7.9 million and $15.0 million in amortization of capitalized costs, respectively.
NOTE 5. ALLOWANCE FOR EXPECTED CREDIT LOSSES
The Company is exposed to credit losses primarily related to accounts receivable and financed receivables derived from customer services revenue. To reduce credit risk for residential accounts receivable, we promote enrollment in our auto-pay programs. In general, we may suspend future services for customers with past due balances. The Company’s credit risk is generally low, as Rollins’ customer base is comprised of a large number of individual customers and dispersed across many different geographical regions.
The Company manages its financed receivables on an aggregate basis when assessing and monitoring credit risks. The Company’s established credit evaluation and monitoring procedures seek to minimize the amount of business we conduct with higher risk customers. The credit quality of a potential obligor is evaluated at the loan origination based on an assessment of the individual’s credit score. Rollins requires a potential obligor to have good credit worthiness with low risk before entering into a contract. Depending upon the individual’s credit score, the Company may accept with 100 % financing, require a significant down payment or turn down the contract. Delinquent accounts are monitored each month. Financed receivables include installment receivable amounts, some of which are due subsequent to one year from the balance sheet dates.
The Company’s allowances for credit losses for trade accounts receivable and financed receivables are developed using historical collection experience, current economic and market conditions, reasonable and supportable forecasts, and a review of the current status of customers’ receivables. The Company’s receivable pools are classified between residential customers, commercial customers, large commercial customers, and financed receivables. Accounts are written off against the allowance for credit losses when the Company determines that amounts are uncollectible, and recoveries of amounts previously written off are recorded when collected. The Company stops accruing interest on these receivables when they are deemed uncollectible. Below is a roll forward of the Company’s allowance for credit losses for the three and six months ended June 30, 2026 and 2025.
| Allowance for Credit Losses | |||||||||||||||||
| (in thousands) | Trade Receivables | Financed Receivables | Total Receivables | ||||||||||||||
| Balance at December 31, 2025 | $ | $ | $ | ||||||||||||||
| Provision for expected credit losses | |||||||||||||||||
| Write-offs charged against the allowance | ( | ( | ( | ||||||||||||||
| Recoveries collected | |||||||||||||||||
| Balance at March 31, 2026 | $ | $ | $ | ||||||||||||||
| Provision for expected credit losses | |||||||||||||||||
| Write-offs charged against the allowance | ( | ( | ( | ||||||||||||||
| Recoveries collected | |||||||||||||||||
| Balance at June 30, 2026 | $ | $ | $ | ||||||||||||||
15
ROLLINS, INC. AND SUBSIDIARIES
| Allowance for Credit Losses | |||||||||||||||||
| (in thousands) | Trade Receivables | Financed Receivables | Total Receivables | ||||||||||||||
| Balance at December 31, 2024 | $ | $ | $ | ||||||||||||||
| Provision for expected credit losses | |||||||||||||||||
| Write-offs charged against the allowance | ( | ( | ( | ||||||||||||||
| Recoveries collected | |||||||||||||||||
| Balance at March 31, 2025 | $ | $ | $ | ||||||||||||||
| Provision for expected credit losses | |||||||||||||||||
| Write-offs charged against the allowance | ( | ( | ( | ||||||||||||||
| Recoveries collected | |||||||||||||||||
| Balance at June 30, 2025 | $ | $ | $ | ||||||||||||||
NOTE 6. GOODWILL AND INTANGIBLE ASSETS
The following table summarizes changes in goodwill during the six months ended June 30, 2026:
(in thousands) | |||||
| Balance at December 31, 2025 | $ | ||||
| Additions | |||||
| Measurement period adjustments | |||||
| Adjustments due to currency translation and other | ( | ||||
| Balance at June 30, 2026 | $ | ||||
The following table sets forth the components of indefinite-lived and amortizable intangible assets as of June 30, 2026 and December 31, 2025.
| June 30, 2026 | December 31, 2025 | ||||||||||||||||||||||||||||||||||||||||
(in thousands) | Gross | Accumulated Amortization | Carrying Value | Gross | Accumulated Amortization | Carrying Value | Useful Life in Years | ||||||||||||||||||||||||||||||||||
| Amortizable intangible assets: | |||||||||||||||||||||||||||||||||||||||||
| Customer contracts | $ | $ | ( | $ | $ | $ | ( | $ | |||||||||||||||||||||||||||||||||
| Trademarks and tradenames | ( | ( | |||||||||||||||||||||||||||||||||||||||
| Other intangible assets | ( | ( | |||||||||||||||||||||||||||||||||||||||
| Total amortizable intangible assets | $ | $ | ( | $ | $ | $ | ( | $ | |||||||||||||||||||||||||||||||||
| Indefinite-lived intangible assets | |||||||||||||||||||||||||||||||||||||||||
| Total intangible assets, excluding goodwill | $ | $ | |||||||||||||||||||||||||||||||||||||||
Amortization expense related to intangible assets was $24.9 million and $22.9 million for the three months ended June 30, 2026 and 2025, respectively. Amortization expense related to intangible assets was $48.7 million and $43.7 million for the six months ended June 30, 2026 and 2025, respectively. Amortizable intangible assets are amortized on a straight-line basis over their economic useful lives.
16
ROLLINS, INC. AND SUBSIDIARIES
Estimated amortization expense for the existing carrying amount of amortizable intangible assets for each of the five succeeding fiscal years as of June 30, 2026 are as follows:
| (in thousands) | |||||
| 2026 (excluding the six months ended June 30, 2026) | $ | ||||
| 2027 | |||||
| 2028 | |||||
| 2029 | |||||
| 2030 | |||||
NOTE 7. DEBT
Short-term Debt
Commercial Paper Program
In March 2025, we established a commercial paper program under which we may issue unsecured commercial paper up to a total of $1 billion outstanding at any time, with maturities of up to 397 days from the date of issue. Borrowings under this program are generally outstanding for 30 days or less. The net proceeds from the issuance of commercial paper are used for various purposes, including general corporate purposes and funding for acquisitions. Information with respect to our outstanding commercial paper borrowings is as follows:
| (in thousands) | June 30, 2026 | December 31, 2025 | |||||||||
Outstanding borrowings (1) | $ | $ | |||||||||
| Weighted average annual interest rate | % | % | |||||||||
| Weighted average remaining term | |||||||||||
(1) Outstanding commercial paper borrowings are net of unamortized discount and are presented under the short-term debt caption of our condensed consolidated statements of financial position.
Bank Overdrafts
As of June 30, 2026, we had no bank overdrafts. As of December 31, 2025, we had $9.3 million of bank overdrafts.
Long-term Debt
Components of long-term debt were as follows:
| (in thousands) | June 30, 2026 | December 31, 2025 | |||||||||
| 2035 Senior Notes | $ | $ | |||||||||
| Revolving Credit Facility | |||||||||||
| Total long-term debt | $ | $ | |||||||||
| Less: unamortized debt discount | ( | ( | |||||||||
| Less: unamortized debt issuance costs | ( | ( | |||||||||
| Total long-term debt, net | $ | $ | |||||||||
17
ROLLINS, INC. AND SUBSIDIARIES
2035 Senior Notes and Exchange Offer
In February 2025, we issued ten-year notes with an aggregate principal amount of $500 million due on February 24, 2035 (the “2035 Senior Notes”) in a private placement to qualified institutional buyers pursuant to Section 4(a)(2) and Rule 144A under the Securities Act. We issued the 2035 Senior Notes at 98.443 % of par, representing a discount of $7.8 million and paid approximately $6.1 million for debt issuance costs. The interest is payable semi-annually in arrears on February 24 and August 24 of each year at 5.25 % per annum, beginning on August 24, 2025, and the entire principal amount is due at the time of maturity. We used the net proceeds from this offering primarily to repay outstanding borrowings under the Revolving Credit Facility, as defined below, as well as for general corporate purposes.
The 2035 Senior Notes are senior unsecured obligations of the Company and, at the time of issuance, were guaranteed by the Company’s subsidiaries that were guarantors under its Revolving Credit Facility, provided for by the Credit Agreement defined below. Subsequent to the issuance of the 2035 Senior Notes, and described further below, we amended our Credit Agreement to release the Company's subsidiaries as guarantors, which also released them as guarantors on the 2035 Senior Notes.
The indenture governing the 2035 Senior Notes contains customary covenants that limit the Company and its subsidiaries’ ability to, among other things, incur liens and certain types of indebtedness. The indenture also provides for customary events of default, which, if any of them occurs, would permit or require the principal, premium, if any, interest and any other monetary obligations on all the then outstanding 2035 Senior Notes to be due and payable immediately. We were in compliance with all covenants as of June 30, 2026.
On May 6, 2025, we commenced an offer to exchange $500 million of the 2035 Senior Notes privately placed in February 2025 (“Initial Notes”) for the $500 million of the 2035 Senior Notes that have been registered under the Securities Act of 1933 (“Exchange Notes”). Approximately 99.7 % of the $500 million aggregate principal amount of the Initial Notes were validly tendered and not withdrawn prior to the expiration of the exchange offer, and were exchanged for Exchange Notes as of June 4, 2025, pursuant to the terms of the exchange offer. The Exchange Notes are identical in all material respects to the Initial Notes, except that the Exchange Notes have no transfer restrictions or registration rights.
The effective interest rate of our 2035 Senior Notes was 5.6 % as of June 30, 2026.
Revolving Credit Facility
In February 2023, the Company entered into a credit agreement (the "Credit Agreement") with, among others, JPMorgan Chase Bank, N.A. (“JPMorgan Chase”), as administrative agent (in such capacity, the “Administrative Agent”).
In March 2025, the Company entered into Amendment No. 1 to the Credit Agreement (the “Amendment No 1”), among the Company, JPMorgan Chase, and the lenders party thereto, which amended the Credit Agreement with, among others, the Company and the Administrative Agent. The Amendment No. 1, among other things, released each of Orkin, LLC, Northwest Exterminating Co., LLC, Clark Pest Control of Stockton, Inc. and HomeTeam Pest Defense, Inc. (collectively, the “Existing Guarantors”) as guarantors under the Credit Agreement. Following the release of the Existing Guarantors from their guarantees of the obligations under the Credit Agreement, no subsidiary of the Company guarantees the obligations under the Credit Agreement.
The Credit Agreement provides for a $1.0 billion revolving credit facility ("Revolving Credit Facility"), which may be denominated in U.S. Dollars and other currencies, subject to a $400 million foreign currency sublimit. Rollins has the ability to expand its borrowing availability under the Credit Agreement in the form of increased revolving commitments or one or more tranches of term loans by up to an additional $750 million, subject to the agreement of the participating lenders and certain other customary conditions. The maturity date of the loans under the Credit Agreement is February 24, 2028.
Loans under the Credit Agreement bear interest, at Rollins’ election, at (i) for loans denominated in U.S. Dollars, (A) an alternate base rate (subject to a floor of 0.00 %), which is the greatest of (x) the prime rate publicly announced from time to time by JPMorgan Chase, (y) the greater of the federal funds effective rate and the Federal Reserve Bank of New York overnight bank funding rate, plus 50 basis points, and (z) Adjusted Term SOFR for a one month interest period, plus a margin ranging from 0.00 % to 0.50 % per annum based on Rollins’ consolidated total net leverage ratio; or (B) the greater of term SOFR for the applicable interest period plus 10 basis points (“Adjusted Term SOFR”) and zero , plus a margin ranging from 1.00 % to 1.50 % per annum based on Rollins’ consolidated total net leverage ratio; and (ii) for loans denominated in other currencies, such interest rates as set forth in the Credit Agreement.
18
ROLLINS, INC. AND SUBSIDIARIES
The Credit Agreement contains customary terms and conditions, including, without limitation, certain financial covenants including covenants restricting Rollins’ ability to incur certain indebtedness or liens, or to merge or consolidate with or sell substantially all of its assets to another entity. Further, the Credit Agreement contains a financial covenant restricting Rollins’ ability to permit the ratio of Rollins’ consolidated total net debt to EBITDA to exceed 3.50 to 1.00. Following certain acquisitions, Rollins may elect to increase the financial covenant level to 4.00 to 1.00 temporarily. The Company is in compliance with applicable debt covenants as of June 30, 2026.
As of June 30, 2026 and December 31, 2025, the Company had no
Letters of Credit
The Company maintained $84.6 million in letters of credit as of June 30, 2026 and $82.4 million as of December 31, 2025. These letters of credit are required by the Company’s insurance carriers, due to the Company’s high deductible insurance program, to secure various workers’ compensation and casualty insurance contracts coverage. The Company believes that it has adequate liquid assets, funding sources and insurance accruals to accommodate potential future insurance claims.
NOTE 8. FAIR VALUE MEASUREMENT
Assets and liabilities recorded at fair value are measured using a three-tier fair value hierarchy, which prioritizes the inputs used in measuring fair value. The levels of the fair value hierarchy are:
•Level 1: observable inputs such as quoted prices in active markets for identical assets or liabilities;
•Level 2: inputs other than quoted prices in active markets in Level 1 that are either directly or indirectly observable; and
•Level 3: unobservable inputs for which little or no market data exists.
Assets and Liabilities Measured at Fair Value on a Recurring Basis
Debt Securities
As of June 30, 2026 and December 31, 2025, we had investments in international bonds of $4.7 million and $6.2 million, respectively. These bonds are accounted for as available for sale securities and are Level 2 assets under the fair value hierarchy. The bonds are recorded at their fair market values and reported within other current assets and other assets on our condensed consolidated statements of financial position. The unrealized gain or loss activity during the three and six months ended June 30, 2026 and 2025 was not significant.
19
ROLLINS, INC. AND SUBSIDIARIES
Contingent Consideration
As of June 30, 2026 and December 31, 2025, the Company had $44.9 million and $37.1 million of acquisition holdback and earnout liabilities payable to former owners of acquired companies, respectively. Holdback and earnout liabilities are considered Level 3 liabilities under the fair value hierarchy. The earnout liabilities were adjusted to reflect the expected probability of payout, and both earnout and holdback liabilities were discounted to their net present value on the Company’s condensed consolidated statements of financial position. The table below presents a summary of the changes in fair value for these liabilities.
| Three Months Ended June 30, | Six Months Ended June 30, | ||||||||||||||||||||||
| (in thousands) | 2026 | 2025 | 2026 | 2025 | |||||||||||||||||||
| Beginning balance | $ | $ | $ | $ | |||||||||||||||||||
| New acquisitions and measurement adjustments | |||||||||||||||||||||||
| Payouts | ( | ( | ( | ( | |||||||||||||||||||
| Interest and fair value adjustments | |||||||||||||||||||||||
| Charge offset, forfeit and other | ( | ( | ( | ( | |||||||||||||||||||
| Ending balance | $ | $ | $ | $ | |||||||||||||||||||
Other Fair Value Disclosures
The carrying amount of cash and cash equivalents, trade and financed receivables, accounts payable, and short-term liabilities, including short-term borrowings under our commercial paper program, approximate fair value due to their short-term nature. The carrying amounts of borrowings outstanding under our Revolving Credit Facility approximate fair value, as interest rates are variable and reflective of market rates.
The following table presents the aggregate fair value and carrying value of our 2035 Senior Notes, which are classified as Level 2 within the fair value hierarchy:
| June 30, 2026 | December 31, 2025 | ||||||||||||||||||||||
| (in thousands) | Fair Value | Carrying Value | Fair Value | Carrying Value | |||||||||||||||||||
| 2035 Senior Notes | $ | $ | $ | $ | |||||||||||||||||||
NOTE 9. CONTINGENCIES
In the normal course of business, the Company and its subsidiaries are involved in, and will continue to be involved in, various claims, arbitrations, contractual disputes, inquiries, investigations, litigation, and tax and other regulatory matters relating to, and arising out of, our businesses and our operations. These matters may involve, but are not limited to, allegations that our services or vehicles caused damage or injury, claims that our services did not achieve the desired results, claims related to acquisitions and allegations by federal, state or local authorities, including taxing and pest control regulatory authorities, of violations of regulations or statutes. In addition, we are parties to employment-related investigations, cases, and claims from time to time, which may include claims on a representative or class action basis alleging wage and hour law violations, claims filed under California's Private Attorneys General Act, and claims and investigations related to our enforcement of post-employment restrictive covenants. We are also involved from time to time in certain environmental matters primarily arising in the normal course of business. We evaluate pending and threatened claims and establish loss contingency reserves based upon outcomes we currently believe to be probable and reasonably estimable in accordance with ASC 450.
The Company retains, up to specified limits, certain risks related to general liability, workers’ compensation and auto liability. The estimated costs of existing and future claims under the retained loss program are accrued based upon historical trends as incidents occur, whether reported or unreported (although actual settlement of the claims may not be made until future periods) and may be subsequently revised based on developments relating to such claims. The Company contracts with an independent third party to provide the Company an estimated liability based upon historical claims information. The actuarial study is a major consideration in establishing the reserve, along with management’s knowledge of changes in business practice and existing claims compared to current balances. Management’s judgment is inherently subjective as a number of factors are outside management’s knowledge and control. Additionally, historical information is
20
ROLLINS, INC. AND SUBSIDIARIES
not always an accurate indication of future events. The accruals and reserves we hold are based on estimates that involve a degree of judgment and are inherently variable and could be overestimated or insufficient. If actual claims exceed our estimates, our operating results could be materially affected, and our ability to take timely corrective actions to limit future costs may be limited.
SEC regulations require us to disclose certain information about proceedings arising under federal, state or local environmental regulations if we reasonably believe that such proceedings may result in monetary sanctions above a stated threshold. Pursuant to SEC regulations, the Company uses a threshold of $1.0 million (which does not exceed the lesser of $1.0 million or 1% of our current assets as of December 31, 2025) for purposes of determining whether disclosure of any such proceedings is required. Also, we will continue to disclose any environmental proceedings that we determine are otherwise material, regardless of the amount of potential monetary sanctions. Currently, there is no required disclosure.
Management does not believe that any pending or threatened claim, proceeding, litigation, regulatory action or investigation, either alone or in the aggregate, will have a material adverse effect on the Company’s financial position, results of operations or liquidity; however, it is possible that an unfavorable outcome of some or all of the matters could result in a charge that might be material to the results of an individual quarter or year.
NOTE 10. STOCKHOLDERS' EQUITY
During the three months ended June 30, 2026, the Company paid $88.1 million, or $0.1825 per share, in cash and stock dividends compared to $79.5 million, or $0.165 per share, during the same period in 2025. During the six months ended June 30, 2026, the Company paid $176.1 million, or $0.3650 per share, in cash and stock dividends compared to $159.4 million, or $0.330 per share, during the same period in 2025.
The Company withholds shares from employees for the payment of their taxes on equity awards that have vested. The Company withheld $0.5 million and $0.3 million in connection with employee tax obligations during the three month periods ended June 30, 2026 and 2025, respectively. The Company withheld $22.8 million and $14.9 million in connection with employee tax obligations during the six month periods ended June 30, 2026 and 2025, respectively.
Share Repurchases
During the three months ended June 30, 2026, the Company paid $20.0 million in open market share repurchases. The Company did not repurchase shares on the open market in 2025.
As we repurchase our common stock, we reduce common stock for par value of the shares repurchased, with the excess of the purchase price over par value recorded as a reduction to additional paid-in capital and retained earnings.
Stock Compensation
The following table summarizes the components of the Company’s stock-based compensation programs, including time-lapsed restricted share awards, performance share unit awards, and employee stock purchase plan, recorded as expense:
| Three Months Ended June 30, | Six Months Ended June 30, | ||||||||||||||||||||||
| (in thousands) | 2026 | 2025 | 2026 | 2025 | |||||||||||||||||||
| Stock-based compensation expense | $ | $ | $ | $ | |||||||||||||||||||
NOTE 11. EARNINGS PER SHARE
The Company reports both basic and diluted earnings per share. Basic earnings per share is computed by dividing net income available to participating common stockholders by the weighted average number of participating common shares outstanding for the period. Diluted earnings per share is calculated by dividing the net income available to participating common shareholders by the diluted weighted average number of shares outstanding for the period. The diluted weighted average number of shares outstanding is the basic weighted number of shares adjusted for any potentially dilutive equity.
21
ROLLINS, INC. AND SUBSIDIARIES
A reconciliation of weighted average shares outstanding is as follows:
| Three Months Ended June 30, | Six Months Ended June 30, | ||||||||||||||||||||||
| (in thousands) | 2026 | 2025 | 2026 | 2025 | |||||||||||||||||||
| Weighted-average outstanding common shares | |||||||||||||||||||||||
| Add participating securities: | |||||||||||||||||||||||
| Weighted-average time-lapse restricted awards | |||||||||||||||||||||||
| Total weighted-average shares outstanding – basic | |||||||||||||||||||||||
| Dilutive effect of restricted stock units and PSUs | |||||||||||||||||||||||
| Weighted-average shares outstanding – diluted | |||||||||||||||||||||||
NOTE 12. INCOME TAXES
The Company’s provision for income taxes is recorded on an interim basis based upon the Company’s estimate of the annual effective income tax rate for the full year applied to “ordinary” income or loss, adjusted each quarter for discrete items. The Company recorded a provision for income taxes of $45.8 million and $49.8 million for the three months ended June 30, 2026 and 2025, and $75.1 million and $82.1 million for the six months ended June 30, 2026 and 2025, respectively.
The Company’s effective tax rate decreased to 24.2 % in the second quarter of 2026 compared with 26.0 % in the second quarter of 2025. During the six months ended June 30, 2026, the Company's effective tax rate decreased to 23.0 % compared to 25.0 % in the six months ended June 30, 2025. The reduced rate for both periods was primarily due to the purchase of transferable federal income tax credits during the three and six months ended June 30, 2026.
Cash paid for taxes, net of refunds, during the six months ended June 30, 2026 was $134.8 million, inclusive of cash paid to taxing authorities and third parties for purchases of investment tax credits.
NOTE 13. SEGMENT AND GEOGRAPHIC INFORMATION
Segment Information
The Company operates under one reportable segment which contains our residential, commercial, and termite and ancillary service offerings. The Company's chief operating decision maker ("CODM") is the chief executive officer. The CODM uses net income to assess financial performance and allocate resources. This financial metric is used by the CODM to make key operating decisions, such as the determination of the rate of growth investments and the allocation of budget between cost categories. The measure of segment assets is reported on the condensed consolidated statements of financial position as total consolidated assets.
22
ROLLINS, INC. AND SUBSIDIARIES
The following table presents selected financial information with respect to the Company’s single reportable segment:
| Three Months Ended June 30, | Six Months Ended June 30, | ||||||||||||||||||||||
| (in thousands) | 2026 | 2025 | 2026 | 2025 | |||||||||||||||||||
| Revenue | $ | $ | $ | $ | |||||||||||||||||||
| Less: | |||||||||||||||||||||||
| Cost of services provided (exclusive of depreciation and amortization below): | |||||||||||||||||||||||
| Employee expenses | |||||||||||||||||||||||
| Materials and supplies | |||||||||||||||||||||||
| Insurance and claims | |||||||||||||||||||||||
| Fleet expenses | |||||||||||||||||||||||
Other cost of services provided (1) | |||||||||||||||||||||||
| Total cost of services provided (exclusive of depreciation and amortization below) | $ | $ | $ | $ | |||||||||||||||||||
| Sales, general and administrative: | |||||||||||||||||||||||
| Selling and marketing expenses | |||||||||||||||||||||||
| Administrative employee expenses | |||||||||||||||||||||||
| Insurance and claims | |||||||||||||||||||||||
| Fleet expenses | |||||||||||||||||||||||
Other sales, general and administrative (2) | |||||||||||||||||||||||
| Total sales, general and administrative | $ | $ | $ | $ | |||||||||||||||||||
| Depreciation and amortization | |||||||||||||||||||||||
| Interest expense, net | |||||||||||||||||||||||
| Other expense (income), net | ( | ( | |||||||||||||||||||||
| Income tax expense | |||||||||||||||||||||||
| Net income | $ | $ | $ | $ | |||||||||||||||||||
1) Other cost of services provided includes facilities costs, professional services, maintenance and repairs, software license costs, and other expenses directly related to providing services.
2) Other sales, general and administrative includes facilities costs, professional services, maintenance and repairs, software license costs, bad debt expense, and other administrative expenses.
See the condensed consolidated financial statements for other financial information regarding the Company’s reportable segment. See Note 4, Revenue for further information on revenue.
Geographic Information
The Company's long-lived tangible assets, as well as the Company's operating lease right-of-use assets recognized in the condensed consolidated statements of financial position were located as follows:
| (in thousands) | June 30, 2026 | December 31, 2025 | |||||||||
| United States | $ | $ | |||||||||
| International | |||||||||||
23
ROLLINS, INC. AND SUBSIDIARIES
NOTE 14. SUBSEQUENT EVENTS
Quarterly Dividend
On July 21, 2026, the Company’s Board of Directors declared a regular quarterly cash dividend on its common stock of $0.1825 per share payable on September 10, 2026 to shareholders of record at the close of business on August 10, 2026.
24
ROLLINS, INC. AND SUBSIDIARIES
ITEM 2. MANAGEMENT’S DISCUSSION AND ANALYSIS OF FINANCIAL CONDITION AND RESULTS OF OPERATIONS
The following discussion should be read in conjunction with our financial statements and the related notes that appear elsewhere in this quarterly report on Form 10-Q.
GENERAL OPERATING COMMENTS
Below is a summary of the key operating results for the three months ended June 30, 2026:
•Second quarter revenues were $1.1 billion, an increase of 7.9% over the second quarter of 2025 with organic revenues* increasing 5.7%. This represents our 99th consecutive quarter of revenue growth.
•Quarterly operating income was $201.4 million, an increase of 1.5% over the second quarter of 2025. Quarterly operating margin was 18.7%, a decrease of 110 basis points versus the second quarter of 2025. Adjusted operating income* was $209.9 million, an increase of 2.0% over the prior year. Adjusted operating margin* was 19.5%, a decrease of 110 basis points compared to the prior year.
•Quarterly net income was $143.9 million, an increase of 1.7% over the prior year. Adjusted net income* was $151.9 million, an increase of 3.4% over the prior year.
•Adjusted EBITDA* was $236.3 million, an increase of 2.2% over the prior year. Adjusted EBITDA margin* was 21.9%, a decrease of 120 basis points versus the second quarter of 2025.
•Quarterly EPS was $0.30 per diluted share, a 3.4% increase over the prior year EPS of $0.29. Adjusted EPS* was $0.32 per diluted share, an increase of 6.7% over the prior year.
•Operating cash flow was $172.5 million for the quarter, a decrease of 1.5% compared to the prior year. Free cash flow* was $166 million for the quarter, a decrease of 1.2% compared to the prior year. Cash flow was negatively impacted due to the timing of tax payments associated with our tax credit planning strategy. The Company invested $116.8 million in acquisitions, $6.4 million in capital expenditures, and paid dividends totaling $88.1 million.
Our reported results for the second quarter fell short of our expectations. Organic revenue* growth in the quarter was negatively impacted by slower growth in parts of our residential service offering due to a decline in lead volume. Specifically, those of our brands that are more reliant on consumer-initiated demand through search, digital media and inbound calls experienced a more challenging demand environment. Encouragingly, other areas of our business that leverage relationship-based channels, such as home builders and door-to-door sales, delivered solid organic revenue* growth in the quarter, reinforcing the importance of our diversified, multi-brand approach. Although we remain cautious regarding near-term demand trends, lead volume improved toward the end of June and has maintained this momentum through the first few weeks of July.
We are focused on execution, accountability, and consistent improvement. We have implemented organizational and operational changes to improve local execution, strengthen accountability, and better align resources with current demand conditions, while continuing to invest in areas that will drive long-term growth.
Given our first half results and visibility into near-term operating conditions, we are updating our full-year outlook. We expect to report at least 6% organic revenue* growth, 2% to 3% inorganic revenue* growth, adjusted incremental EBITDA margin* of at least 10%, and free cash flow conversion* of greater than 100% in 2026. We believe the medium-term financial outlook and opportunities outlined at our Investor & Analyst Conference in May remain ahead of us and we maintain conviction in our ability to achieve those financial targets over time.
*Amounts are non-GAAP financial measures. See the schedules below for a discussion of non-GAAP financial metrics including a reconciliation to the most directly comparable GAAP measure.
RECENT DEVELOPMENTS AND ECONOMIC CONDITIONS
The continued disruption in economic markets due to inflation, changing interest rates, tariffs, trade disputes, business interruptions due to natural disasters and changes in weather patterns, employee shortages, and supply chain issues all pose
25
ROLLINS, INC. AND SUBSIDIARIES
challenges which may adversely affect our future performance. The Company continues to execute various strategies previously implemented to help mitigate the impact of these economic disruptors. However, the Company cannot reasonably estimate whether these strategies will help mitigate the impact of these economic disruptors in the future.
The Company’s condensed consolidated financial statements reflect estimates and assumptions made by management that affect the reported amounts of assets and liabilities and related disclosures as of the date of the condensed consolidated financial statements. The Company considered the impact of economic trends on the assumptions and estimates used in preparing the condensed consolidated financial statements. In the opinion of management, all material adjustments necessary for a fair presentation of the Company’s financial results for the quarter have been made. These adjustments are of a normal recurring nature but are complicated by the continued uncertainty surrounding these macroeconomic trends. The severity, magnitude and duration of certain economic trends continue to be uncertain and are difficult to predict. Therefore, our accounting estimates and assumptions may change over time in response to economic trends and may change materially in future periods.
The extent to which these economic trends will continue to impact the Company’s business, financial condition and results of operations is uncertain. Therefore, we cannot reasonably estimate the full future impacts of these matters at this time.
RESULTS OF OPERATIONS
Quarter ended June 30, 2026 compared to quarter ended June 30, 2025
| Three Months Ended June 30, | ||||||||||||||||||||
| Variance | ||||||||||||||||||||
| (in thousands, except per share data) | 2026 | 2025 | $ | % | ||||||||||||||||
| GAAP Metrics | ||||||||||||||||||||
| Revenues | $ | 1,078,576 | $ | 999,527 | $ | 79,049 | 7.9 | % | ||||||||||||
Gross profit (1) | $ | 569,946 | $ | 537,666 | $ | 32,280 | 6.0 | % | ||||||||||||
Gross profit margin (1) | 52.8 | % | 53.8 | % | (100) bps | |||||||||||||||
| Operating income | $ | 201,359 | $ | 198,333 | $ | 3,026 | 1.5 | % | ||||||||||||
| Operating margin | 18.7 | % | 19.8 | % | (110) bps | |||||||||||||||
| Net income | $ | 143,910 | $ | 141,489 | $ | 2,421 | 1.7 | % | ||||||||||||
| EPS | $ | 0.30 | $ | 0.29 | $ | 0.01 | 3.4 | % | ||||||||||||
| Operating cash flow | $ | 172,506 | $ | 175,122 | $ | (2,616) | (1.5) | % | ||||||||||||
| Non-GAAP Metrics | ||||||||||||||||||||
Adjusted operating income (2) | $ | 209,939 | $ | 205,900 | $ | 4,039 | 2.0 | % | ||||||||||||
Adjusted operating margin (2) | 19.5 | % | 20.6 | % | (110) bps | |||||||||||||||
Adjusted net income (2) | $ | 151,927 | $ | 146,902 | $ | 5,025 | 3.4 | % | ||||||||||||
Adjusted EPS (2) | $ | 0.32 | $ | 0.30 | $ | 0.02 | 6.7 | % | ||||||||||||
Adjusted EBITDA (2) | $ | 236,292 | $ | 231,152 | $ | 5,140 | 2.2 | % | ||||||||||||
Adjusted EBITDA margin (2) | 21.9 | % | 23.1 | % | (120) bps | |||||||||||||||
Free cash flow (2) | $ | 166,077 | $ | 168,046 | $ | (1,969) | (1.2) | % | ||||||||||||
(1) Exclusive of depreciation and amortization
(2) Amounts are non-GAAP financial measures. See "Non-GAAP Financial Measures" of this Form 10-Q for a discussion of non-GAAP financial metrics including a reconciliation to the most directly comparable GAAP measure.
26
ROLLINS, INC. AND SUBSIDIARIES
The following table presents financial information, including our significant expense categories, for the three months ended June 30, 2026 and 2025:
| Three Months Ended June 30, | ||||||||||||||
| 2026 | 2025 | |||||||||||||
| $ | % of Revenue | $ | % of Revenue | |||||||||||
| Revenue | $ | 1,078,576 | 100.0 | % | $ | 999,527 | 100.0 | % | ||||||
| Less: | ||||||||||||||
| Cost of services provided (exclusive of depreciation and amortization below): | ||||||||||||||
| Employee expenses | 328,787 | 30.5 | % | 298,354 | 29.8 | % | ||||||||
| Materials and supplies | 66,339 | 6.2 | % | 59,500 | 6.0 | % | ||||||||
| Insurance and claims | 21,932 | 2.0 | % | 20,734 | 2.1 | % | ||||||||
| Fleet expenses | 46,959 | 4.4 | % | 41,834 | 4.2 | % | ||||||||
Other cost of services provided (1) | 44,613 | 4.1 | % | 41,439 | 4.1 | % | ||||||||
| Total cost of services provided (exclusive of depreciation and amortization below) | $ | 508,630 | 47.2 | % | $ | 461,861 | 46.2 | % | ||||||
| Sales, general and administrative: | ||||||||||||||
| Selling and marketing expenses | 151,967 | 14.1 | % | 140,177 | 14.0 | % | ||||||||
| Administrative employee expenses | 95,733 | 8.9 | % | 89,303 | 8.9 | % | ||||||||
| Insurance and claims | 13,239 | 1.2 | % | 12,939 | 1.3 | % | ||||||||
| Fleet expenses | 11,775 | 1.1 | % | 10,443 | 1.0 | % | ||||||||
Other sales, general and administrative (2) | 62,263 | 5.8 | % | 54,734 | 5.5 | % | ||||||||
| Total sales, general and administrative | $ | 334,977 | 31.1 | % | $ | 307,596 | 30.8 | % | ||||||
| Depreciation and amortization | 33,610 | 3.1 | % | 31,737 | 3.2 | % | ||||||||
| Interest expense, net | 9,391 | 0.9 | % | 7,380 | 0.7 | % | ||||||||
| Other (income) expense, net | 2,214 | 0.2 | % | (292) | — | % | ||||||||
| Income tax expense | 45,844 | 4.3 | % | 49,756 | 5.0 | % | ||||||||
| Net income | $ | 143,910 | 13.3 | % | $ | 141,489 | 14.2 | % | ||||||
1) Other cost of services provided includes facilities costs, professional services, maintenance & repairs, software license costs, and other expenses directly related to providing services.
2) Other sales, general and administrative includes facilities costs, professional services, maintenance & repairs, software license costs, bad debt expense, and other administrative expenses.
27
ROLLINS, INC. AND SUBSIDIARIES
Revenues
The following presents a summary of revenues by service offering for the three months ended June 30, 2026 and June 30, 2025, respectively:
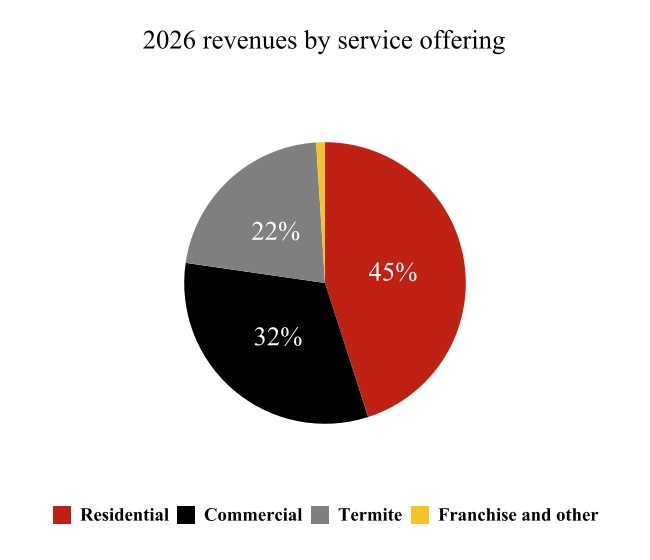
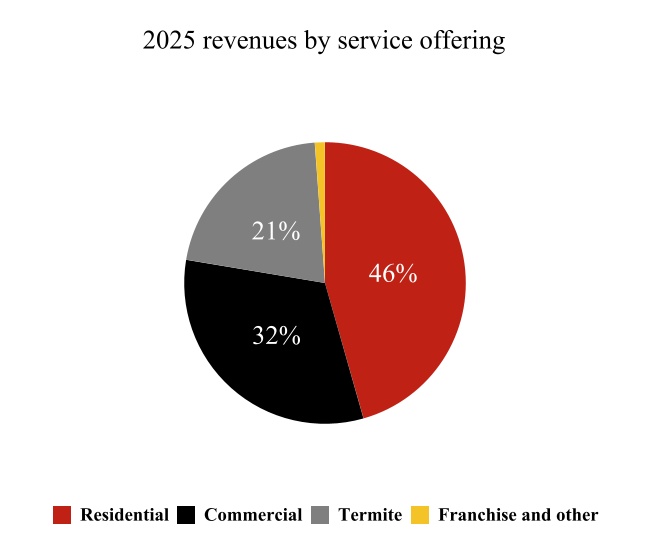
Revenues for the quarter ended June 30, 2026 were $1.1 billion, an increase of $79.0 million, or 7.9%, from 2025 revenues of $999.5 million. The increase in revenues was driven by demand from our customers across all major service offerings. Organic revenue* growth was 5.7% with acquisitions adding 2.2% in the quarter. Residential pest control revenue increased 6.6%, commercial pest control revenue increased 8.6% and termite and ancillary services grew 10.5% including both organic and acquisition-related growth in each area. Organic revenue* growth was 3.6% in residential, 7.2% in commercial, and 8.9% in termite and ancillary activity. The Company’s foreign operations accounted for approximately 7% of total revenues for the quarters ended June 30, 2026 and June 30, 2025.
*Amounts are non-GAAP financial measures. See "Non-GAAP Financial Measures" of this Form 10-Q for a discussion of non-GAAP financial metrics including a reconciliation to the most directly comparable GAAP measure.
Revenues are impacted by weather conditions, including climate change and the seasonal nature of the Company’s pest and termite control services. The increase in pest activity, as well as the metamorphosis of termites in the spring and summer (the occurrence of which is determined by the change in seasons), has historically resulted in an increase in the Company’s revenues as evidenced by the following table:
| Consolidated Net Revenues | |||||||||||||||||
| (in thousands) | 2026 | 2025 | 2024 | ||||||||||||||
| First quarter | $ | 906,424 | $ | 822,504 | $ | 748,349 | |||||||||||
| Second quarter | 1,078,576 | 999,527 | 891,920 | ||||||||||||||
| Third quarter | — | 1,026,106 | 916,270 | ||||||||||||||
| Fourth quarter | — | 912,913 | 832,169 | ||||||||||||||
| Year to date | $ | 1,985,000 | $ | 3,761,050 | $ | 3,388,708 | |||||||||||
Gross Profit (exclusive of Depreciation and Amortization)
Gross profit for the quarter ended June 30, 2026 was $569.9 million, an increase of $32.3 million, or 6.0%, compared to $537.7 million for the quarter ended June 30, 2025.
Gross margin decreased 100 basis points to 52.8% in 2026 compared to 53.8% in 2025. The decrease is primarily due to 70 basis points of higher employee expenses, including higher employee medical costs and service salaries, 20 basis points of higher materials and supplies, and 20 basis points of higher fleet expenses associated with higher fuel costs. This was partially offset by 10 basis points of leverage in insurance and claims costs.
28
ROLLINS, INC. AND SUBSIDIARIES
Sales, General and Administrative
For the quarter ended June 30, 2026, sales, general and administrative ("SG&A") expenses were $335.0 million, an increase of $27.4 million, or 8.9%, compared to the quarter ended June 30, 2025.
As a percentage of revenue, SG&A increased 30 basis points to 31.1% from 30.8% in the prior year, primarily due to 10 basis points of higher selling and marketing costs and 10 basis points of higher fleet expenses associated with higher fuel costs. The remaining increase was driven by other SG&A costs.
Depreciation and Amortization
For the quarter ended June 30, 2026, depreciation and amortization increased $1.9 million, or 5.9%, compared to the quarter ended June 30, 2025. The increase was due to higher amortization of intangible assets from acquisitions, most notably from the acquisition of Romex.
Operating Income
For the quarter ended June 30, 2026, operating income increased $3.0 million, or 1.5%, compared to the prior year.
As a percentage of revenue, operating income was 18.7%, a decrease of 110 basis points compared to the second quarter of 2025. Operating margin decreased mostly due to higher employee expenses, higher materials and supplies, higher fleet expenses, and other SG&A expenses.
Interest Expense, Net
During the quarter ended June 30, 2026, interest expense, net increased $2.0 million compared to the prior year primarily due to a higher average debt balance associated with higher borrowings under our commercial paper program.
Other (Income) Expense, Net
During the quarter ended June 30, 2026, other (income) expense, net decreased $2.5 million primarily due to higher losses on non-operational asset sales and disposals.
Income Taxes
The Company’s effective tax rate was 24.2% in the second quarter of 2026 and 26.0% in the second quarter of 2025. The reduced rate is primarily due to the purchase of transferable federal income tax credits during the three months ended June 30, 2026.
29
ROLLINS, INC. AND SUBSIDIARIES
Six months ended June 30, 2026 compared to six months ended June 30, 2025
| Six Months Ended June 30, | ||||||||||||||||||||
| Variance | ||||||||||||||||||||
| (in thousands, except per share data) | 2026 | 2025 | $ | % | ||||||||||||||||
| GAAP Metrics | ||||||||||||||||||||
| Revenues | $ | 1,985,000 | $ | 1,822,031 | $ | 162,969 | 8.9 | % | ||||||||||||
Gross profit (1) | $ | 1,030,848 | $ | 960,036 | $ | 70,812 | 7.4 | % | ||||||||||||
Gross profit margin (1) | 51.9 | % | 52.7 | % | (80) | bps | ||||||||||||||
| Operating income | $ | 346,845 | $ | 340,981 | $ | 5,864 | 1.7 | % | ||||||||||||
| Operating margin | 17.5 | % | 18.7 | % | (120) | bps | ||||||||||||||
| Net income | $ | 251,748 | $ | 246,737 | $ | 5,011 | 2.0 | % | ||||||||||||
| EPS | $ | 0.52 | $ | 0.51 | $ | 0.01 | 2.0 | % | ||||||||||||
| Operating cash flow | $ | 290,873 | $ | 322,014 | $ | (31,141) | (9.7) | % | ||||||||||||
| Non-GAAP Metrics | ||||||||||||||||||||
Adjusted operating income (2) | $ | 362,732 | $ | 352,769 | $ | 9,963 | 2.8 | % | ||||||||||||
Adjusted operating margin (2) | 18.3 | % | 19.4 | % | (110) | bps | ||||||||||||||
Adjusted net income (2) | $ | 265,156 | $ | 254,775 | $ | 10,381 | 4.1 | % | ||||||||||||
Adjusted EPS (2) | $ | 0.55 | $ | 0.53 | $ | 0.02 | 3.8 | % | ||||||||||||
Adjusted EBITDA (2) | $ | 415,761 | $ | 403,009 | $ | 12,752 | 3.2 | % | ||||||||||||
Adjusted EBITDA margin (2) | 20.9 | % | 22.1 | % | (120) | bps | ||||||||||||||
Free cash flow (2) | $ | 277,305 | $ | 308,157 | $ | (30,852) | (10.0) | % | ||||||||||||
(1) Exclusive of depreciation and amortization
(2) Amounts are non-GAAP financial measures. See "Non-GAAP Financial Measures" of this Form 10-Q for a discussion of non-GAAP financial metrics including a reconciliation to the most directly comparable GAAP measure.
30
ROLLINS, INC. AND SUBSIDIARIES
The following table presents financial information, including our significant expense categories, for the six months ended June 30, 2026 and 2025:
| Six Months Ended June 30, | ||||||||||||||
| 2026 | 2025 | |||||||||||||
| $ | % of Revenue | $ | % of Revenue | |||||||||||
| Revenue | $ | 1,985,000 | 100.0 | % | $ | 1,822,031 | 100.0 | % | ||||||
| Less: | ||||||||||||||
| Cost of services provided (exclusive of depreciation and amortization below): | ||||||||||||||
| Employee expenses | 618,509 | 31.2 | % | 560,077 | 30.7 | % | ||||||||
| Materials and supplies | 119,556 | 6.0 | % | 107,991 | 5.9 | % | ||||||||
| Insurance and claims | 43,079 | 2.2 | % | 37,258 | 2.0 | % | ||||||||
| Fleet expenses | 89,131 | 4.5 | % | 78,691 | 4.3 | % | ||||||||
Other cost of services provided (1) | 83,877 | 4.2 | % | 77,978 | 4.3 | % | ||||||||
| Total cost of services provided (exclusive of depreciation and amortization below) | $ | 954,152 | 48.1 | % | $ | 861,995 | 47.3 | % | ||||||
| Sales, general and administrative: | ||||||||||||||
| Selling and marketing expenses | 263,966 | 13.3 | % | 238,428 | 13.1 | % | ||||||||
| Administrative employee expenses | 185,482 | 9.3 | % | 170,783 | 9.4 | % | ||||||||
| Insurance and claims | 25,822 | 1.3 | % | 22,943 | 1.3 | % | ||||||||
| Fleet expenses | 22,037 | 1.1 | % | 19,846 | 1.1 | % | ||||||||
Other sales, general and administrative (2) | 120,588 | 6.1 | % | 106,109 | 5.8 | % | ||||||||
| Total sales, general and administrative | $ | 617,895 | 31.1 | % | $ | 558,109 | 30.6 | % | ||||||
| Depreciation and amortization | 66,108 | 3.3 | % | 60,946 | 3.3 | % | ||||||||
| Interest expense, net | 18,242 | 0.9 | % | 13,176 | 0.7 | % | ||||||||
| Other (income) expense, net | 1,751 | 0.1 | % | (984) | (0.1) | % | ||||||||
| Income tax expense | 75,104 | 3.8 | % | 82,052 | 4.5 | % | ||||||||
| Net income | $ | 251,748 | 12.7 | % | $ | 246,737 | 13.5 | % | ||||||
1) Other cost of services provided includes facilities costs, professional services, maintenance & repairs, software license costs, and other expenses directly related to providing services.
2) Other sales, general and administrative includes facilities costs, professional services, maintenance & repairs, software license costs, bad debt expense, and other administrative expenses.
31
ROLLINS, INC. AND SUBSIDIARIES
Revenues
The following presents a summary of revenues by service offering for the six months ended June 30, 2026 and June 30, 2025, respectively:
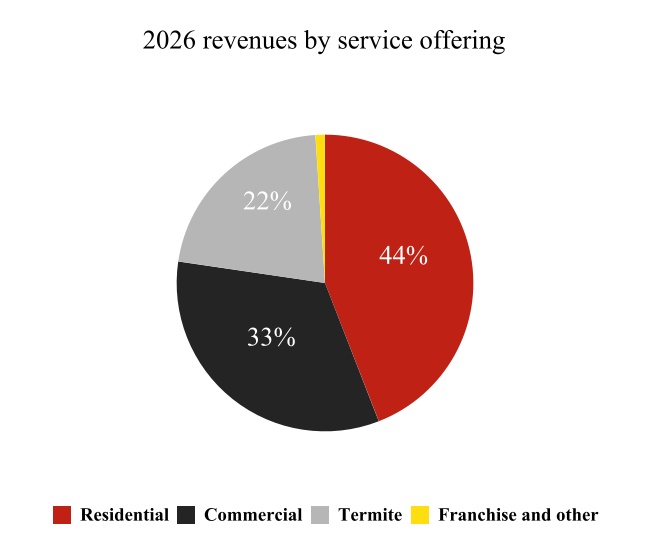
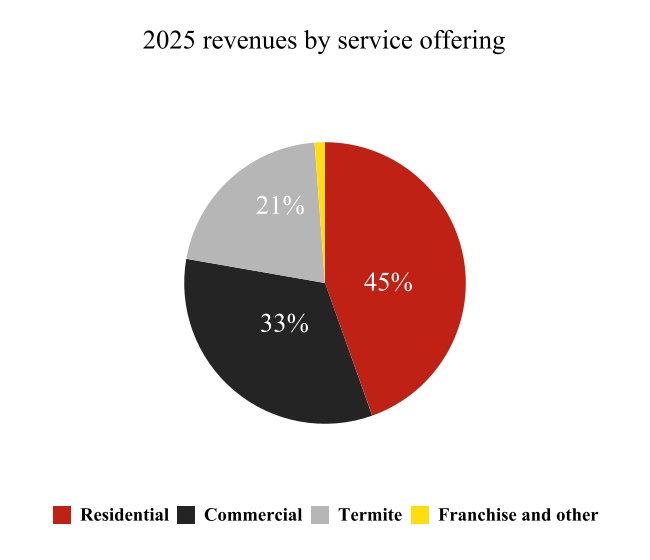
Revenues for the six months ended June 30, 2026 were $2.0 billion, an increase of $163.0 million, or 8.9%, from 2025 revenues of $1.8 billion. The increase in revenues was driven by demand from our customers across all major service offerings. Organic revenue* growth was 6.1% with acquisitions adding 2.8% in the six months ended June 30, 2026. Residential pest control revenue increased 7.8%, commercial pest control revenue increased 9.1% and termite and ancillary services grew 11.9%, including both organic and acquisition-related growth in each area. Organic revenue* growth was 3.9% in residential, 7.4% in commercial, and 9.3% in termite and ancillary. The Company’s foreign operations accounted for approximately 7% of total revenues for the six months ended June 30, 2026 and June 30, 2025.
*Amounts are non-GAAP financial measures. See "Non-GAAP Financial Measures" of this Form 10-Q for a discussion of non-GAAP financial metrics including a reconciliation to the most directly comparable GAAP measure.
Gross Profit (exclusive of Depreciation and Amortization)
Gross profit for the six months ended June 30, 2026 was $1.0 billion, an increase of $70.8 million, or 7.4%, compared to $960.0 million for the six months ended June 30, 2025.
Gross margin decreased to 51.9% in 2026 versus 52.7% in 2025. The decrease is primarily due to 50 basis points of higher employee expenses, including medical costs and service salaries, 20 basis points of higher insurance and claims costs, 20 basis points of higher fleet expenses primarily associated with higher fuel costs, and 10 basis points of higher materials and supplies costs. This was partially offset by lower other expenses.
Fuel costs represent less than 2% of revenues and we expect these costs to remain below 2% for the year.
Sales, General and Administrative
For the six months ended June 30, 2026, SG&A expenses increased $59.8 million, or 10.7%, compared to the six months ended June 30, 2025.
As a percentage of revenue, SG&A expenses increased 50 basis points to 31.1% from 30.6% in the prior year. This is primarily due to 20 basis points of higher selling and marketing costs associated with continued investments in growth initiatives and higher other SG&A expenses, partially offset by lower administrative employee costs.
32
ROLLINS, INC. AND SUBSIDIARIES
Depreciation and Amortization
For the six months ended June 30, 2026, depreciation and amortization increased $5.2 million, or 8.5%, compared to the six months ended June 30, 2025. The increase was primarily due to higher amortization of intangible assets from acquisitions, most notably from the acquisitions of Saela and Romex.
Operating Income
For the six months ended June 30, 2026, operating income increased $5.9 million, or 1.7%, compared to the six months ended June 30, 2025.
As a percentage of revenue, operating income decreased 120 basis points to 17.5% from 18.7% in the prior year. Operating margin decreased mostly due to higher employee expenses, higher insurance and claims costs, higher fleet expenses, and higher other operating expenses.
Interest Expense, Net
For the six months ended June 30, 2026, interest expense, net increased $5.1 million, compared to the six months ended June 30, 2025, primarily due to a higher average debt balance associated with higher borrowings under our commercial paper program.
We expect interest expense to be approximately $40 million in 2026 associated with borrowings under our 2035 Senior Notes and commercial paper program.
Other (Income) Expense, Net
During the six months ended June 30, 2026, other income decreased $2.7 million compared to the six months ended June 30, 2025, primarily due to higher losses on non-operational asset sales and disposals.
Income Taxes
During the six months ended June 30, 2026, the Company’s effective tax rate decreased to 23.0% compared to 25.0% in 2025. The reduced rate is primarily due to the purchase of transferable federal income tax credits during the six months ended June 30, 2026.
We expect our effective tax rate to be under 25% in 2026.
33
ROLLINS, INC. AND SUBSIDIARIES
Non-GAAP Financial Measures
Reconciliation of GAAP and non-GAAP Financial Measures
A non-GAAP financial measure is a numerical measure of financial performance, financial position, or cash flows that either 1) excludes amounts, or is subject to adjustments that have the effect of excluding amounts, that are included in the most directly comparable measure calculated and presented in accordance with GAAP in the condensed consolidated statements of income, financial position, or cash flows, or 2) includes amounts, or is subject to adjustments that have the effect of including amounts, that are excluded from the most directly comparable measure so calculated and presented.
These measures should not be considered in isolation or as a substitute for revenues, net income, earnings per share or other performance measures prepared in accordance with GAAP. Management believes all of these non-GAAP financial measures are useful to provide investors with information about current trends in, and period-over-period comparisons of, the Company's results of operations. An analysis of any non-GAAP financial measure should be used in conjunction with results presented in accordance with GAAP.
The Company has used the following non-GAAP financial measures in this Form 10-Q:
Organic revenues
Organic revenues are calculated as revenues less the revenues from acquisitions completed within the prior 12 months and excluding the revenues from divested businesses. Acquisition revenues are based on the trailing 12-month revenue of our acquired entities. Management uses organic revenues, and organic revenues by type to compare revenues over various periods excluding the impact of acquisitions and divestitures.
Adjusted operating income and adjusted operating margin
Adjusted operating income and adjusted operating margin are calculated by adding back to operating income those expenses associated with the amortization of intangible assets and adjustments to the fair value of contingent consideration resulting from the acquisitions of Fox Pest Control, Saela Pest Control and Romex Pest Control. Adjusted operating margin is calculated as adjusted operating income divided by revenues. Management uses adjusted operating income and adjusted operating margin as measures of operating performance because these measures allow the Company to compare performance consistently over various periods.
Adjusted net income and adjusted EPS
Adjusted net income and adjusted EPS are calculated by adding back to the GAAP measures amortization of intangible assets and adjustments to the fair value of contingent consideration resulting from the acquisitions of Fox Pest Control, Saela Pest Control and Romex Pest Control, excluding gains and losses on the sale of non-operational assets and gains on the sale of businesses, and by further subtracting the tax impact of those expenses, gains, or losses. Management uses adjusted net income and adjusted EPS as measures of operating performance because these measures allow the Company to compare performance consistently over various periods.
EBITDA, EBITDA margin, adjusted EBITDA, adjusted EBITDA margin, incremental EBITDA margin and adjusted incremental EBITDA margin
EBITDA is calculated by adding back to net income depreciation and amortization, interest expense, net, and provision for income taxes. EBITDA margin is calculated as EBITDA divided by revenues. Adjusted EBITDA and adjusted EBITDA margin are calculated by further adding back those expenses associated with the adjustments to the fair value of contingent consideration resulting from the acquisitions of Fox Pest Control, Saela Pest Control and Romex Pest Control, and excluding gains and losses on the sale of non-operational assets and gains on the sale of businesses. Management uses EBITDA, EBITDA margin, adjusted EBITDA and adjusted EBITDA margin as measures of operating performance because these measures allow the Company to compare performance consistently over various periods. Incremental EBITDA margin is calculated as the change in EBITDA divided by the change in revenue. Management uses incremental EBITDA margin as a measure of operating performance because this measure allows the Company to compare performance consistently over various periods. Adjusted incremental EBITDA margin is calculated as the change in adjusted EBITDA divided by the change in revenue. Management uses adjusted incremental EBITDA margin as a measure of operating performance because this measure allows the Company to compare performance consistently over various periods.
34
ROLLINS, INC. AND SUBSIDIARIES
Free cash flow and free cash flow conversion
Free cash flow is calculated by subtracting capital expenditures from cash provided by operating activities. Management uses free cash flow to demonstrate the Company’s ability to maintain its asset base and generate future cash flows from operations. Free cash flow conversion is calculated as free cash flow divided by net income.
Management uses free cash flow conversion to demonstrate how much net income is converted into cash. Management believes that free cash flow is an important financial measure for use in evaluating the Company’s liquidity. Free cash flow should be considered in addition to, rather than as a substitute for, net cash provided by operating activities as a measure of our liquidity. Additionally, the Company’s definition of free cash flow is limited, in that it does not represent residual cash flows available for discretionary expenditures, due to the fact that the measure does not deduct the payments required for debt service and other contractual obligations or payments made for business acquisitions. Therefore, management believes it is important to view free cash flow as a measure that provides supplemental information to our condensed consolidated statements of cash flows.
Adjusted sales, general, and administrative ("SG&A")
Adjusted SG&A is calculated by removing the adjustments to the fair value of contingent consideration resulting from the acquisitions of Fox Pest Control, Saela Pest Control and Romex Pest Control. Management uses adjusted SG&A to compare SG&A expenses consistently over various periods.
Leverage ratio
Leverage ratio, a financial valuation measure, is calculated by dividing adjusted net debt by adjusted EBITDAR. Adjusted net debt is calculated by adding short-term debt and operating lease liabilities to total long-term debt less a cash adjustment of 90% of total consolidated cash. Adjusted EBITDAR is calculated by adding back to net income depreciation and amortization, interest expense, net, provision for income taxes, operating lease cost, and stock-based compensation expense. Management uses leverage ratio as an assessment of overall liquidity, financial flexibility, and leverage.
35
ROLLINS, INC. AND SUBSIDIARIES
Set forth below is a reconciliation of the non-GAAP financial measures contained in this report with their most directly comparable GAAP measures (unaudited, in thousands, except per share data and margins).
Three Months Ended June 30, | Six Months Ended June 30, | ||||||||||||||||||||||||||||||||||||||||||||||
| Variance | Variance | ||||||||||||||||||||||||||||||||||||||||||||||
| 2026 | 2025 | $ | % | 2026 | 2025 | $ | % | ||||||||||||||||||||||||||||||||||||||||
| Reconciliation of Revenues to Organic Revenues | |||||||||||||||||||||||||||||||||||||||||||||||
| Revenues | $ | 1,078,576 | $ | 999,527 | 79,049 | 7.9 | $ | 1,985,000 | $ | 1,822,031 | 162,969 | 8.9 | |||||||||||||||||||||||||||||||||||
| Revenues from acquisitions | (21,817) | — | (21,817) | 2.2 | (51,675) | — | (51,675) | 2.8 | |||||||||||||||||||||||||||||||||||||||
| Organic revenues | $ | 1,056,759 | $ | 999,527 | 57,232 | 5.7 | $ | 1,933,325 | $ | 1,822,031 | 111,294 | 6.1 | |||||||||||||||||||||||||||||||||||
| Reconciliation of Residential Revenues to Organic Residential Revenues | |||||||||||||||||||||||||||||||||||||||||||||||
| Residential revenues | $ | 485,845 | $ | 455,665 | 30,180 | 6.6 | $ | 875,349 | $ | 811,978 | 63,371 | 7.8 | |||||||||||||||||||||||||||||||||||
| Residential revenues from acquisitions | (13,950) | — | (13,950) | 3.0 | (32,095) | — | (32,095) | 3.9 | |||||||||||||||||||||||||||||||||||||||
| Residential organic revenues | $ | 471,895 | $ | 455,665 | 16,230 | 3.6 | $ | 843,254 | $ | 811,978 | 31,276 | 3.9 | |||||||||||||||||||||||||||||||||||
| Reconciliation of Commercial Revenues to Organic Commercial Revenues | |||||||||||||||||||||||||||||||||||||||||||||||
| Commercial revenues | $ | 347,913 | $ | 320,490 | 27,423 | 8.6 | $ | 659,639 | $ | 604,847 | 54,792 | 9.1 | |||||||||||||||||||||||||||||||||||
| Commercial revenues from acquisitions | (4,467) | — | (4,467) | 1.4 | (9,838) | — | (9,838) | 1.7 | |||||||||||||||||||||||||||||||||||||||
| Commercial organic revenues | $ | 343,446 | $ | 320,490 | 22,956 | 7.2 | $ | 649,801 | $ | 604,847 | 44,954 | 7.4 | |||||||||||||||||||||||||||||||||||
| Reconciliation of Termite and Ancillary Revenues to Organic Termite and Ancillary Revenues | |||||||||||||||||||||||||||||||||||||||||||||||
| Termite and ancillary revenues | $ | 234,151 | $ | 211,855 | 22,296 | 10.5 | $ | 429,574 | $ | 383,985 | 45,589 | 11.9 | |||||||||||||||||||||||||||||||||||
| Termite and ancillary revenues from acquisitions | (3,400) | — | (3,400) | 1.6 | (9,742) | — | (9,742) | 2.6 | |||||||||||||||||||||||||||||||||||||||
| Termite and ancillary organic revenues | $ | 230,751 | $ | 211,855 | 18,896 | 8.9 | $ | 419,832 | $ | 383,985 | 35,847 | 9.3 | |||||||||||||||||||||||||||||||||||
| Reconciliation of Franchise and Other Revenues to Organic Franchise and Other Revenues | |||||||||||||||||||||||||||||||||||||||||||||||
| Franchise and other revenues | $ | 10,667 | $ | 11,517 | (850) | (7.4) | $ | 20,438 | $ | 21,221 | (783) | (3.7) | |||||||||||||||||||||||||||||||||||
| Franchise and other revenues from acquisitions | — | — | — | — | — | — | — | — | |||||||||||||||||||||||||||||||||||||||
| Franchise and other organic revenues | $ | 10,667 | $ | 11,517 | (850) | (7.4) | $ | 20,438 | $ | 21,221 | (783) | (3.7) | |||||||||||||||||||||||||||||||||||
36
ROLLINS, INC. AND SUBSIDIARIES
| Three Months Ended June 30, | Variance | Six Months Ended June 30, | Variance | ||||||||||||||||||||||||||||||||||||||||||||
| 2026 | 2025 | $ | % | 2026 | 2025 | $ | % | ||||||||||||||||||||||||||||||||||||||||
| Reconciliation of Operating Income to Adjusted Operating Income and Adjusted Operating Margin | |||||||||||||||||||||||||||||||||||||||||||||||
| Operating income | $ | 201,359 | $ | 198,333 | $ | 346,845 | $ | 340,981 | |||||||||||||||||||||||||||||||||||||||
Acquisition-related expenses (1) | 8,580 | 7,567 | 15,887 | 11,788 | |||||||||||||||||||||||||||||||||||||||||||
| Adjusted operating income | $ | 209,939 | $ | 205,900 | 4,039 | 2.0 | $ | 362,732 | $ | 352,769 | 9,963 | 2.8 | |||||||||||||||||||||||||||||||||||
| Revenues | $ | 1,078,576 | $ | 999,527 | $ | 1,985,000 | $ | 1,822,031 | |||||||||||||||||||||||||||||||||||||||
| Operating margin | 18.7 | % | 19.8 | % | 17.5 | % | 18.7 | % | |||||||||||||||||||||||||||||||||||||||
| Adjusted operating margin | 19.5 | % | 20.6 | % | 18.3 | % | 19.4 | % | |||||||||||||||||||||||||||||||||||||||
| Reconciliation of Net Income to Adjusted Net Income and Adjusted EPS | |||||||||||||||||||||||||||||||||||||||||||||||
| Net income | $ | 143,910 | $ | 141,489 | $ | 251,748 | $ | 246,737 | |||||||||||||||||||||||||||||||||||||||
Acquisition-related expenses (1) | 8,580 | 7,567 | 15,887 | 11,788 | |||||||||||||||||||||||||||||||||||||||||||
Loss (gain) on sale of assets, net (2) | 2,196 | (292) | 2,135 | (984) | |||||||||||||||||||||||||||||||||||||||||||
Tax impact of adjustments (3) | (2,759) | (1,862) | (4,614) | (2,766) | |||||||||||||||||||||||||||||||||||||||||||
| Adjusted net income | $ | 151,927 | $ | 146,902 | 5,025 | 3.4 | $ | 265,156 | $ | 254,775 | 10,381 | 4.1 | |||||||||||||||||||||||||||||||||||
| EPS - basic and diluted | $ | 0.30 | $ | 0.29 | $ | 0.52 | $ | 0.51 | |||||||||||||||||||||||||||||||||||||||
Acquisition-related expenses (1) | 0.02 | 0.02 | 0.03 | 0.02 | |||||||||||||||||||||||||||||||||||||||||||
Loss (gain) on sale of assets, net (2) | — | — | — | — | |||||||||||||||||||||||||||||||||||||||||||
Tax impact of adjustments (3) | (0.01) | — | (0.01) | (0.01) | |||||||||||||||||||||||||||||||||||||||||||
Adjusted EPS - basic and diluted (4) | $ | 0.32 | $ | 0.30 | 0.02 | 6.7 | $ | 0.55 | $ | 0.53 | 0.02 | 3.8 | |||||||||||||||||||||||||||||||||||
| Weighted average shares outstanding – basic | 481,375 | 484,643 | 481,380 | 484,530 | |||||||||||||||||||||||||||||||||||||||||||
| Weighted average shares outstanding – diluted | 481,389 | 484,674 | 481,397 | 484,559 | |||||||||||||||||||||||||||||||||||||||||||
| Reconciliation of Net Income to EBITDA, Adjusted EBITDA, EBITDA Margin, Incremental EBITDA Margin, Adjusted EBITDA Margin, and Adjusted Incremental EBITDA Margin | |||||||||||||||||||||||||||||||||||||||||||||||
| Net income | $ | 143,910 | $ | 141,489 | $ | 251,748 | $ | 246,737 | |||||||||||||||||||||||||||||||||||||||
| Depreciation and amortization | 33,610 | 31,737 | 66,108 | 60,946 | |||||||||||||||||||||||||||||||||||||||||||
| Interest expense, net | 9,391 | 7,380 | 18,242 | 13,176 | |||||||||||||||||||||||||||||||||||||||||||
| Provision for income taxes | 45,844 | 49,756 | 75,104 | 82,052 | |||||||||||||||||||||||||||||||||||||||||||
| EBITDA | $ | 232,755 | $ | 230,362 | 2,393 | 1.0 | $ | 411,202 | $ | 402,911 | 8,291 | 2.1 | |||||||||||||||||||||||||||||||||||
Acquisition-related expenses (1) | 1,341 | 1,082 | 2,424 | 1,082 | |||||||||||||||||||||||||||||||||||||||||||
Loss (gain) on sale of assets, net (2) | 2,196 | (292) | 2,135 | (984) | |||||||||||||||||||||||||||||||||||||||||||
| Adjusted EBITDA | $ | 236,292 | $ | 231,152 | 5,140 | 2.2 | $ | 415,761 | $ | 403,009 | 12,752 | 3.2 | |||||||||||||||||||||||||||||||||||
| Revenues | $ | 1,078,576 | $ | 999,527 | 79,049 | $ | 1,985,000 | $ | 1,822,031 | 162,969 | |||||||||||||||||||||||||||||||||||||
| EBITDA margin | 21.6 | % | 23.0 | % | 20.7 | % | 22.1 | % | |||||||||||||||||||||||||||||||||||||||
| Incremental EBITDA margin | 3.0 | % | 5.1 | % | |||||||||||||||||||||||||||||||||||||||||||
| Adjusted EBITDA margin | 21.9 | % | 23.1 | % | 20.9 | % | 22.1 | % | |||||||||||||||||||||||||||||||||||||||
| Adjusted incremental EBITDA margin | 6.5 | % | 7.8 | % | |||||||||||||||||||||||||||||||||||||||||||
| Reconciliation of Net Cash Provided by Operating Activities to Free Cash Flow and Free Cash Flow Conversion | |||||||||||||||||||||||||||||||||||||||||||||||
| Net cash provided by operating activities | $ | 172,506 | $ | 175,122 | $ | 290,873 | $ | 322,014 | |||||||||||||||||||||||||||||||||||||||
| Capital expenditures | (6,429) | (7,076) | (13,568) | (13,857) | |||||||||||||||||||||||||||||||||||||||||||
| Free cash flow | $ | 166,077 | $ | 168,046 | (1,969) | (1.2) | $ | 277,305 | $ | 308,157 | (30,852) | (10.0) | |||||||||||||||||||||||||||||||||||
| Free cash flow conversion | 115.4 | % | 118.8 | % | 110.2 | % | 124.9 | % | |||||||||||||||||||||||||||||||||||||||
37
ROLLINS, INC. AND SUBSIDIARIES
| Three Months Ended June 30, | Six Months Ended June 30, | ||||||||||||||||||||||
| 2026 | 2025 | 2026 | 2025 | ||||||||||||||||||||
| Reconciliation of SG&A to Adjusted SG&A | |||||||||||||||||||||||
| SG&A | $ | 334,977 | $ | 307,596 | $ | 617,895 | $ | 558,109 | |||||||||||||||
Acquisition-related expenses (1) | 1,341 | 1,082 | 2,424 | 1,082 | |||||||||||||||||||
| Adjusted SG&A | $ | 333,636 | $ | 306,514 | $ | 615,471 | $ | 557,027 | |||||||||||||||
| Revenues | $ | 1,078,576 | $ | 999,527 | $ | 1,985,000 | $ | 1,822,031 | |||||||||||||||
| Adjusted SG&A as a % of revenues | 30.9 | % | 30.7 | % | 31.0 | % | 30.6 | % | |||||||||||||||
Period Ended June 30, 2026 | Period Ended December 31, 2025 | ||||||||||
| Reconciliation of Debt and Net Income to Leverage Ratio | |||||||||||
Short-term debt (5) | $ | 215,918 | $ | 123,683 | |||||||
Long-term debt (6) | 500,000 | 500,000 | |||||||||
Operating lease liabilities (7) | 412,278 | 428,175 | |||||||||
Cash adjustment (8) | (98,177) | (90,004) | |||||||||
| Adjusted net debt | $ | 1,030,019 | $ | 961,854 | |||||||
| Net income | 531,716 | 526,705 | |||||||||
| Depreciation and amortization | 129,906 | 124,744 | |||||||||
| Interest expense, net | 33,624 | 28,558 | |||||||||
| Provision for income taxes | 167,273 | 174,221 | |||||||||
Operating lease cost (9) | 167,888 | 159,924 | |||||||||
| Stock-based compensation expense | 41,393 | 39,707 | |||||||||
| Adjusted EBITDAR | $ | 1,071,800 | $ | 1,053,859 | |||||||
| Leverage ratio | 1.0x | 0.9x | |||||||||
(1) Consists of expenses resulting from the amortization of intangible assets and adjustments to the fair value of contingent consideration associated with the acquisitions of Fox Pest Control, Saela Pest Control and Romex Pest Control. While we exclude such expenses in this non-GAAP measure, the revenue from the acquired companies is reflected in this non-GAAP measure and the acquired assets contribute to revenue generation.
(2) Consists of the gain or loss on the sale of non-operational assets.
(3) The tax effect of the adjustments is calculated using the applicable statutory tax rates for the respective periods.
(4) In some cases, the sum of the individual EPS amounts may not equal total adjusted EPS calculations due to rounding.
(5) The Company's short-term borrowings are presented under the short-term debt caption of our condensed consolidated statement of financial position, net of unamortized discounts.
(6) As of June 30, 2026 and December 31, 2025, the Company had outstanding borrowings of $500.0 million from the issuance of our 2035 Senior Notes. These borrowings are presented under the long-term debt caption of our condensed consolidated statement of financial position, net of unamortized discount and unamortized debt issuance costs. As of June 30, 2026 and December 31, 2025, the Company had no outstanding borrowings under the Revolving Credit Facility.
(7) Operating lease liabilities are presented under the operating lease liabilities - current and operating lease liabilities, less current portion captions of our condensed consolidated statement of financial position.
(8) Represents 90% of cash and cash equivalents per our condensed consolidated statement of financial position as of both periods presented.
(9) Operating lease cost excludes short-term lease cost associated with leases that have a duration of 12 months or less.
LIQUIDITY AND CAPITAL RESOURCES
Sources and Uses of Cash
The Company’s $109.1 million of total cash at June 30, 2026 is held at various banking institutions. As of June 30, 2026, approximately $46.2 million is held in cash by foreign subsidiaries and the remaining $62.9 million is held at domestic banks and also includes cash-in-transit.
38
ROLLINS, INC. AND SUBSIDIARIES
We intend to continue to grow the business in the international markets where we have a presence. As it relates to our unremitted earnings in foreign jurisdictions, we assert that foreign cash earnings in excess of working capital and cash needed for strategic investments and acquisitions are not intended to be indefinitely reinvested offshore.
We believe our current cash and cash equivalents balances, future cash flows expected to be generated from operating activities, access to debt financing based on our creditworthiness, our $1 billion commercial paper program which is backstopped by our Revolving Credit Facility, as defined below, and available borrowings under our Revolving Credit Facility will be sufficient to finance our current operations and obligations and fund expansion of the business for the foreseeable future.
Commercial Paper Program
In March 2025, we established a commercial paper program under which we may issue unsecured commercial paper up to a total of $1 billion outstanding at any time, with maturities of up to 397 days from the date of issue. Borrowings under this program are generally outstanding for 30 days or less. The net proceeds from the issuance of commercial paper are used for various purposes, including general corporate purposes and funding for acquisitions. As of June 30, 2026 and December 31, 2025, there were $215.9 million and $114.4 million of outstanding borrowings under the commercial paper program, respectively.
2035 Senior Notes
In February 2025, we issued ten-year notes with an aggregate principal amount of $500 million due on February 24, 2035 (the “2035 Senior Notes”) in a private placement to qualified institutional buyers pursuant to Section 4(a)(2) and Rule 144A under the Securities Act. We issued the 2035 Senior Notes at 98.443% of par, representing a discount of $7.8 million, and paid approximately $6.1 million for debt issuance costs. The interest is payable semi-annually in arrears on February 24 and August 24 of each year at 5.25% per annum, beginning on August 24, 2025, and the entire principal amount is due at the time of maturity. We used the net proceeds from this offering primarily to repay outstanding borrowings under the Revolving Credit Facility, as well as for general corporate purposes.
On May 6, 2025, we commenced an offer to exchange $500 million of the 2035 Senior Notes privately placed in February 2025 (“Initial Notes”) for the $500 million of the 2035 Senior Notes that have been registered under the Securities Act of 1933 (“Exchange Notes”). Approximately 99.7% of the $500 million aggregate principal amount of the Initial Notes were validly tendered and not withdrawn prior to the expiration of the exchange offer, and were exchanged for Exchange Notes as of June 4, 2025, pursuant to the terms of the exchange offer. The Exchange Notes are identical in all material respects to the Initial Notes, except that the Exchange Notes will have no transfer restrictions or registration rights.
Revolving Credit Facility
In February 2023, the Company entered into a credit agreement (the "Credit Agreement") with, among others, JPMorgan Chase Bank, N.A. (“JPMorgan Chase”), as administrative agent (in such capacity, the “Administrative Agent”).
The Credit Agreement provides for a $1.0 billion revolving credit facility ("Revolving Credit Facility"), which may be denominated in U.S. Dollars and other currencies, subject to a $400 million foreign currency sublimit. Rollins has the ability to expand its borrowing availability under the Credit Agreement in the form of increased revolving commitments or one or more tranches of term loans by up to an additional $750 million, subject to the agreement of the participating lenders and certain other customary conditions. The maturity date of the loans under the Credit Agreement is February 24, 2028.
As of June 30, 2026 and December 31, 2025, the Company had no outstanding borrowings under the Revolving Credit Facility.
Letters of Credit
The Company maintained $84.6 million in letters of credit as of June 30, 2026 and $82.4 million as of December 31, 2025. These letters of credit are required by the Company’s insurance carriers, due to the Company’s high deductible insurance program, to secure various workers’ compensation and casualty insurance contracts coverage. The Company believes that it has adequate liquid assets, funding sources and insurance accruals to accommodate potential future insurance claims.
39
ROLLINS, INC. AND SUBSIDIARIES
The following table sets forth a summary of our cash flows from operating, investing and financing activities for the six month periods presented:
| Six Months Ended June 30, | |||||||||||
| (in thousands) | 2026 | 2025 | |||||||||
| Net cash provided by operating activities | $ | 290,873 | $ | 322,014 | |||||||
| Net cash used in investing activities | (146,209) | (263,091) | |||||||||
| Net cash used in financing activities | (134,722) | (28,570) | |||||||||
| Effect of exchange rate on cash | (861) | 3,052 | |||||||||
| Net increase in cash and cash equivalents | $ | 9,081 | $ | 33,405 | |||||||
Cash Provided by Operating Activities
Cash from operating activities is the principal source of cash generation for our businesses. The most significant source of cash in our cash flow from operations is customer-related activities, the largest of which is collecting cash resulting from services sold. The most significant operating use of cash is to pay our suppliers, employees, and tax authorities. The Company’s operating activities generated net cash of $290.9 million and $322.0 million for the six months ended June 30, 2026 and 2025, respectively. The $31.1 million, or 9.7%, decrease was driven primarily by an increase of approximately $49.7 million in net income tax payments associated with our tax credit planning strategy as well as the timing of cash receipts and cash payments to and from customers, vendors, and employees. Aside from the timing impact of our federal income tax payments, we continued to generate strong operating cash flows. We expect these timing differences to moderate as we go through the year, resulting in a neutral impact on our full-year operating cash flow growth.
Cash Used in Investing Activities
The Company’s investing activities used $146.2 million and $263.1 million for the six months ended June 30, 2026 and 2025, respectively. Cash paid for acquisitions totaled $135.3 million for the six months ended June 30, 2026, compared to $253.6 million for the six months ended June 30, 2025. The Company invested $13.6 million in capital expenditures during the six months ended June 30, 2026, offset by $1.1 million in cash proceeds from the sale of assets, compared with $13.9 million of capital expenditures and $3.5 million in cash proceeds from asset sales in 2025. The Company’s investing activities were funded primarily through existing cash balances, operating cash flows, and proceeds from borrowings, including our commercial paper program.
Cash Used in Financing Activities
Cash of $134.7 million was used in financing activities during the six months ended June 30, 2026, compared with $28.6 million during the six months ended June 30, 2025. A total of $175.9 million was paid in cash dividends ($0.3650 per share) during the six months ended June 30, 2026, compared to $159.4 million in cash dividends paid ($0.330 per share) during the six months ended June 30, 2025.
During the six months ended June 30, 2026, the Company received net borrowings of $101.5 million under its commercial paper program compared to net borrowings under its 2035 Senior Notes and Revolving Credit Facility and commercial paper program of $155.2 million during 2025.
During the six months ended June 30, 2026, the Company paid $9.5 million of contingent consideration, compared to $3.4 million during the six months ended June 30, 2025. The Company withheld $22.8 million and $14.9 million of common stock for the six months ended June 30, 2026 and 2025, respectively, in connection with tax withholding obligations of its employees upon vesting of such employees’ equity awards.
During the six months ended June 30, 2026, the Company paid $20.0 million for open market share repurchases. The Company did not repurchase shares on the open market in 2025.
Share Repurchase Program
In 2012, the Company’s Board of Directors authorized the purchase of up to 5 million shares of the Company’s common stock. After adjustments for stock splits, the total authorized shares under the share repurchase plan is 16.9 million shares.
40
ROLLINS, INC. AND SUBSIDIARIES
During the six months ended June 30, 2026, we repurchased 382,089 shares of our $1 par value common stock at a weighted average price of $52.38 per share. As of June 30, 2026, 11.0 million additional shares may be purchased under our share repurchase program.
Active Shelf Registration
On April 29, 2026, the Company filed a Form S-3ASR, which was declared effective immediately. The shelf registration statement on file with the SEC registered the Company’s common stock, preferred stock, debt securities, depositary shares, warrants, rights, purchase contracts and units for future issuance by the Company. The Company may offer and sell some or all of such securities from time to time or through underwriters, brokers or dealers, directly to one or more other purchasers, through a block trade, through agents on a best-efforts basis, through a combination of any of the above methods of sale or through other types of transactions described in the Form S-3ASR. The Company has not sold any securities in a primary offering as of the date of this Form 10-Q. Management is continually evaluating the Company's financial structure and the potential need or desirability of raising additional liquidity through the sale of debt or equity securities. The Form S-3ASR will expire in April 2029.
CONTINGENCIES
In the normal course of business, the Company and its subsidiaries are involved in, and will continue to be involved in, various claims, arbitrations, contractual disputes, inquiries, investigations, litigation, and tax and other regulatory matters relating to, and arising out of, our businesses and our operations. These matters may involve, but are not limited to, allegations that our services or vehicles caused damage or injury, claims that our services did not achieve the desired results, claims related to acquisitions and allegations by federal, state or local authorities, including taxing and pest control regulatory authorities, of violations of regulations or statutes. In addition, we are parties to employment-related investigations, cases, and claims from time to time, which may include claims on a representative or class action basis alleging wage and hour law violations, claims filed under California's Private Attorneys General Act, and claims and investigations related to our enforcement of post-employment restrictive covenants. We are also involved from time to time in certain environmental matters primarily arising in the normal course of business. We evaluate pending and threatened claims and establish loss contingency reserves based upon outcomes we currently believe to be probable and reasonably estimable in accordance with ASC 450.
The Company retains, up to specified limits, certain risks related to general liability, workers’ compensation and auto liability. The estimated costs of existing and future claims under the retained loss program are accrued based upon historical trends as incidents occur, whether reported or unreported (although actual settlement of the claims may not be made until future periods) and may be subsequently revised based on developments relating to such claims. The Company contracts with an independent third party to provide the Company an estimated liability based upon historical claims information. The actuarial study is a major consideration in establishing the reserve, along with management’s knowledge of changes in business practice and existing claims compared to current balances. Management’s judgment is inherently subjective as a number of factors are outside management’s knowledge and control. Additionally, historical information is not always an accurate indication of future events. The accruals and reserves we hold are based on estimates that involve a degree of judgment and are inherently variable and could be overestimated or insufficient. If actual claims exceed our estimates, our operating results could be materially affected, and our ability to take timely corrective actions to limit future costs may be limited.
SEC regulations require us to disclose certain information about proceedings arising under federal, state or local environmental regulations if we reasonably believe that such proceedings may result in monetary sanctions above a stated threshold. Pursuant to SEC regulations, the Company uses a threshold of $1.0 million (which does not exceed the lesser of $1.0 million or 1% of our current assets as of December 31, 2025) for purposes of determining whether disclosure of any such proceedings is required. Also, we will continue to disclose any environmental proceedings that we determine are otherwise material, regardless of the amount of potential monetary sanctions. Currently, there is no required disclosure.
Management does not believe that any pending or threatened claim, proceeding, litigation, regulatory action or investigation, either alone or in the aggregate, will have a material adverse effect on the Company’s financial position, results of operations or liquidity; however, it is possible that an unfavorable outcome of some or all of the matters could result in a charge that might be material to the results of an individual quarter or year.
41
ROLLINS, INC. AND SUBSIDIARIES
CRITICAL ACCOUNTING ESTIMATES
There have been no significant changes in our identified critical accounting estimates as disclosed in Part II, Item 7, "Management's Discussion and Analysis of Financial Condition and Results of Operations - Critical Accounting Estimates" of our 2025 Form 10-K.
CAUTION REGARDING FORWARD-LOOKING STATEMENTS
This Quarterly Report on Form 10-Q as well as other written or oral statements by the Company may contain “forward-looking statements” as defined in the Private Securities Litigation Reform Act of 1995. We have based these forward-looking statements on our current opinions, expectations, intentions, beliefs, plans, objectives, assumptions and projections about future events and financial trends affecting the operating results and financial condition of our business. Although we believe that these forward-looking statements are reasonable, we cannot assure you that we will achieve or realize these plans, intentions, or expectations. Generally, statements that do not relate to historical facts, including statements concerning possible or assumed future actions, business strategies, events or results of operations, are forward-looking statements. The words “believe,” “continue,” “could,” “estimate,” “expect,” “intend,” “may,” “might,” “plan,” “possible,” “potential,” “predict,” “should,” “will,” “would,” and similar expressions may identify forward-looking statements, but the absence of these words does not mean that a statement is not forward-looking. Forward-looking statements in this Quarterly Report on Form 10-Q include, but are not limited to, statements regarding:
•expectations with respect to our financial and business performance and strategy;
•expansion efforts and growth opportunities, including, but not limited, to anticipated organic growth and recent and future acquisitions and onboarding efforts with respect to such acquisitions;
•our belief that the medium-term financial outlook and opportunities outlined at our Investor & Analyst Conference in May are intact;
•our belief that the momentum established late in the second quarter provides a stronger foundation as we move through the second half of the year;
•the Romex and Saela acquisition expanding the Rollins family of brands and driving long-term value;
•the expected strategic and synergistic benefits of acquisitions, the expected tax deductibility of acquisition-related goodwill, and the expected useful lives of acquired intangible assets;
•the Company's credit risk and expectations regarding credit losses;
•the expected recognition of unearned revenue over future periods;
•the recoverability and amortization of incremental costs of obtaining contracts with customers;
•the expected impact of recently issued accounting standards on our condensed consolidated financial statements and related disclosures;
•the impact of inflation, changing interest rates, business interruptions due to natural disasters and changes in the weather patterns, employee shortages, and supply chain issues;
•the economic impact of changes to global trade policies, including the imposition of tariffs, and changes in materials and supplies and fleet-related expenses;
•our ability to execute strategies intended to help mitigate the impact of economic disruptors;
•our belief that fuel costs will remain below 2% of revenues in 2026;
•our belief that our effective tax rate will be under 25% in 2026;
•our expectation that the timing of tax payments will moderate and cash flow growth will improve in future quarters;
•the preliminary nature of certain acquisition purchase price allocations, including the valuations of goodwill, customer contracts, and trademarks and tradenames, which remain provisional and are subject to adjustment during the measurement period;
42
ROLLINS, INC. AND SUBSIDIARIES
•our belief that interest expense will be approximately $40 million in 2026 associated with borrowings under our 2035 Senior Notes and commercial paper program;
•sufficiency of current cash and cash equivalents balances, future cash flows, access to debt financing based on our creditworthiness, our $1 billion commercial paper program, and available borrowings under our Revolving Credit Facility to finance our current and future operations and expansions;
•our belief that the Company has adequate liquid assets, funding sources and insurance accruals to accommodate potential future insurance claims;
•our intent to continue to grow the business in international markets where we have a presence;
•our intent with respect to the reinvestment or repatriation of foreign cash earnings;
•our approach to capital allocation inclusive of dividends, share repurchases, acquisitions and other investments;
•our ability or decision to offer and sell securities under our automatic shelf registration statement and our evaluation of the potential need or desirability of raising additional liquidity through the sale of debt or equity securities;
•our belief that no pending or threatened claim, proceeding, litigation, regulatory action or investigation, either alone or in the aggregate, including but not limited to claims filed under California's Private Attorneys General Act will have a material adverse effect on our financial position, results of operations or liquidity; and
•estimates, assumptions, and projections related to our application of critical accounting policies, described in more detail under “Critical Accounting Estimates.”
These forward-looking statements are based on information available as of the date of this report, and current expectations, forecasts, and assumptions, and involve a number of judgments, risks and uncertainties. Important factors could cause actual results to differ materially from those indicated or implied by forward-looking statements including, but not limited to, those set forth in the sections entitled “Risk Factors” in our Annual Report on Form 10-K for the fiscal year ended December 31, 2025 and may also be described from time to time in our future reports filed with the SEC.
Accordingly, forward-looking statements should not be relied upon as representing our views as of any subsequent date, and we do not undertake any obligation to update forward-looking statements to reflect events or circumstances after the date they were made, whether as a result of new information, future events or otherwise, except as may be required by law.
ITEM 3. QUANTITATIVE AND QUALITATIVE DISCLOSURES ABOUT MARKET RISK
For information regarding our exposure to certain market risks, see “Quantitative and Qualitative Disclosures about Market Risk,” in Part II, Item 7.A of our 2025 Form 10-K. There were no material changes to our market risk exposure during the six months ended June 30, 2026.
ITEM 4. CONTROLS AND PROCEDURES
The Disclosure Committee, with the participation of our principal executive officer and principal financial officer, conducted an evaluation of the effectiveness of the design and operation of our disclosure controls and procedures, as defined in rules 13a-15(e) and 15d-15(e) under the Securities Exchange Act of 1934, as amended (the “Exchange Act”) as of June 30, 2026 (the “Evaluation Date”). Based on this evaluation, our principal executive officer and principal financial officer concluded that our disclosure controls and procedures were effective at the reasonable assurance level as of the Evaluation Date to ensure that the information required to be included in reports filed under the Exchange Act is recorded, processed, summarized and reported within the time periods specified in SEC rules and forms.
During the second quarter, the Company acquired Romex Pest Control (“Romex”). The Company is currently in the process of integrating Romex into its assessment of its internal control over financial reporting. In accordance with the SEC’s published guidance, management’s assessment, and conclusions on the effectiveness of our disclosure controls and procedures as of June 30, 2026, excludes an assessment of the internal control over financial reporting of Romex.
43
ROLLINS, INC. AND SUBSIDIARIES
Changes in Internal Controls Over Financial Reporting
Other than described above with respect to Romex, there were no changes in the Company’s internal control over financial reporting, as defined in Rule 13a-15(f) under the Exchange Act, during the quarter ended June 30, 2026 that have materially affected, or are reasonably likely to materially affect, the Company’s internal control over financial reporting.
44
ROLLINS, INC. AND SUBSIDIARIES
PART II OTHER INFORMATION
ITEM 1. LEGAL PROCEEDINGS
In the normal course of business, the Company and its subsidiaries are involved in, and will continue to be involved in, various claims, arbitrations, contractual disputes, inquiries, investigations, litigation, and tax and other regulatory matters relating to, and arising out of, our businesses and our operations. These matters may involve, but are not limited to, allegations that our services or vehicles caused damage or injury, claims that our services did not achieve the desired results, claims related to acquisitions and allegations by federal, state or local authorities, including taxing and pest control regulatory authorities, of violations of regulations or statutes. In addition, we are parties to employment-related investigations, cases, and claims from time to time, which may include claims on a representative or class action basis alleging wage and hour law violations, claims filed under California's Private Attorneys General Act and claims and investigations related to our enforcement of post-employment restrictive covenants. We are also involved from time to time in certain environmental matters primarily arising in the normal course of business. We evaluate pending and threatened claims and establish loss contingency reserves based upon outcomes we currently believe to be probable and reasonably estimable in accordance with ASC 450.
The Company retains, up to specified limits, certain risks related to general liability, workers’ compensation and auto liability. The estimated costs of existing and future claims under the retained loss program are accrued based upon historical trends as incidents occur, whether reported or unreported (although actual settlement of the claims may not be made until future periods) and may be subsequently revised based on developments relating to such claims. The Company contracts with an independent third party to provide the Company an estimated liability based upon historical claims information. The actuarial study is a major consideration in establishing the reserve, along with management’s knowledge of changes in business practice and existing claims compared to current balances. Management’s judgment is inherently subjective as a number of factors are outside management’s knowledge and control. Additionally, historical information is not always an accurate indication of future events. The accruals and reserves we hold are based on estimates that involve a degree of judgment and are inherently variable and could be overestimated or insufficient. If actual claims exceed our estimates, our operating results could be materially affected, and our ability to take timely corrective actions to limit future costs may be limited.
SEC regulations require us to disclose certain information about proceedings arising under federal, state or local environmental regulations if we reasonably believe that such proceedings may result in monetary sanctions above a stated threshold. Pursuant to SEC regulations, the Company uses a threshold of $1.0 million (which does not exceed the lesser of $1.0 million or 1% of our current assets as of December 31, 2025) for purposes of determining whether disclosure of any such proceedings is required. Also, we will continue to disclose any environmental proceedings that we determine are otherwise material, regardless of the amount of potential monetary sanctions. Currently, there is no required disclosure.
Management does not believe that any pending or threatened claim, proceeding, litigation, regulatory action or investigation, either alone or in the aggregate, will have a material adverse effect on the Company’s financial position, results of operations or liquidity; however, it is possible that an unfavorable outcome of some or all of the matters could result in a charge that might be material to the results of an individual quarter or year.
ITEM 1A. RISK FACTORS
There have been no material changes from the risk factors previously disclosed in the Company’s Annual Report on Form 10-K filed with the Securities and Exchange Commission for the year ended December 31, 2025.
45
ROLLINS, INC. AND SUBSIDIARIES
ITEM 2. UNREGISTERED SALES OF EQUITY SECURITIES AND USE OF PROCEEDS.
The following table presents the Company's share repurchase activity for the period from April 1, 2026 to June 30, 2026.
| Period | Total number of shares purchased (1) | Weighted- average price paid per share | Total number of shares purchased as part of publicly announced repurchases (2) | Maximum number of shares that may yet be purchased under the repurchase plan (2) | ||||||||||||||||||||||
| April 1 to 30, 2026 | 8,089 | $ | 54.01 | — | 11,415,625 | |||||||||||||||||||||
| May 1 to 31, 2026 | 321,794 | $ | 53.23 | 321,549 | 11,094,076 | |||||||||||||||||||||
| June 1 to 30, 2026 | 60,540 | $ | 47.90 | 60,540 | 11,033,536 | |||||||||||||||||||||
| Total | 390,423 | 382,089 | ||||||||||||||||||||||||
(1)Includes 8,334 shares withheld by the Company in connection with tax withholding obligations of its employees upon vesting of such employees' restricted stock awards.
(2)The Company has a share repurchase plan, adopted in 2012, to repurchase up to 16.9 million shares of the Company’s common stock. The plan has no expiration date. As of June 30, 2026, the Company had a remaining authorization to repurchase 11.0 million shares of the Company's common stock under this program.
ITEM 3. DEFAULTS UPON SENIOR SECURITIES
None.
ITEM 4. MINE SAFETY DISCLOSURES
None.
46
ROLLINS, INC. AND SUBSIDIARIES
ITEM 5. OTHER INFORMATION
Rule 10b5-1 Trading Plans
Securities Trading Plans of Directors and Executive Officers
During the three months ended June 30, 2026, the following directors and “officers” (as defined in Rule 16a-1(f) under the Securities Exchange Act of 1934, as amended) adopted , modified or terminated
Name and Title | Date of Adoption of the Rule 10b5-1 Trading Plan | Scheduled Expiration Date of the Rule 10b5-1 Trading Plan | Total Amount of Securities to Be Sold | Transactions Pursuant to 10b5-1 Trading Plan | Early Termination of the Rule 10b5-1 Trading Plan | ||||||||||||
| Sales to occur on or after August 13, 2026, if certain limit prices are met | If all | ||||||||||||||||
47
ROLLINS, INC. AND SUBSIDIARIES
ITEM 6. EXHIBITS
| Exhibit No. | Exhibit Description | Incorporated By Reference | Filed Herewith | ||||||||||||||
| Form | Date | Number | |||||||||||||||
| 3.1 | 10-Q | August 1, 2005 | (3)(i)(A) | ||||||||||||||
| 3.2 | 10-K | March 11, 2005 | (3)(i)(B) | ||||||||||||||
| 3.3 | 10-Q | August 1, 2005 | (3)(i)(C) | ||||||||||||||
| 3.4 | 10-K | February 25, 2015 | (3)(i)(E) | ||||||||||||||
| 3.5 | 10-Q | July 29, 2015 | (3)(i)(F) | ||||||||||||||
| 3.6 | 10-Q | April 26, 2019 | (3)(i)(G) | ||||||||||||||
| 3.7 | 10-Q | July 30, 2021 | (3)(i)(H) | ||||||||||||||
| 3.8 | 10-Q | July 25, 2024 | 3.8 | ||||||||||||||
| 4.1 | 10-K | March 26, 1999 | (4) | ||||||||||||||
| 4.2 | 10-K | February 12, 2026 | 4.2 | ||||||||||||||
| 4.3 | 8-K | February 24, 2025 | 4.1 | ||||||||||||||
| 4.4 | 8-K | February 24, 2025 | 4.2 | ||||||||||||||
| 4.5 | 8-K | February 24, 2025 | 4.3 | ||||||||||||||
| 4.6 | 8-K | March 21, 2025 | 4.2 | ||||||||||||||
| 10.1* | 10.1 | X | |||||||||||||||
| 31.1 | X | ||||||||||||||||
| 31.2 | X | ||||||||||||||||
| 32.1** | X | ||||||||||||||||
| 101.INS | Inline XBRL Instance Document | X | |||||||||||||||
| 101.SCH | Inline XBRL Schema Document | X | |||||||||||||||
| 101.CAL | Inline XBRL Calculation Linkbase Document | X | |||||||||||||||
| 101.LAB | Inline XBRL Labels Linkbase Document | X | |||||||||||||||
| 101.PRE | Inline XBRL Presentation Linkbase Document | X | |||||||||||||||
| 101.DEF | Inline XBRL Definition Linkbase Document | X | |||||||||||||||
| 104 | Cover Page Interactive Data File (embedded with the Inline XBRL document) | X | |||||||||||||||
____________________
* Indicates management contract or compensatory plans or arrangements.
** Furnished with this report
ROLLINS, INC. AND SUBSIDIARIES
SIGNATURES
Pursuant to the requirements of the Securities Exchange Act of 1934, the registrant has duly caused this report to be signed on its behalf by the undersigned thereunto duly authorized.
| ROLLINS, INC. | ||||||||
| (Registrant) | ||||||||
Date: July 23, 2026 | By: | /s/ William W. Harkins | ||||||
| William W. Harkins | ||||||||
| Principal Financial and Accounting Officer | ||||||||